Leading indicators are predictive signals that forecast future economic activity and market trends, allowing investors to anticipate changes before they occur.
Recognizing the patterns and signals leading indicators provide can give an investor a significant advantage. By keenly observing these indicators, you can promptly make strategic decisions to buy or sell assets.
Incorporating leading indicators into your investment strategy involves more than just recognizing them; it requires analyzing historical data and understanding how they correlate with market movements.
Identifying and applying relevant indicators is crucial in markets and securities. A strategic portfolio can be achieved by combining technical analysis and interpretation of leading indicators, effectively managing risks, and maximizing returns.
Technical analysis studies historical market data like price and volume to predict future behavior. Leading indicators, such as moving averages or relative strength index (RSI), provide insights into market momentum. It’s important to assess the reliability of these indicators, considering the influence of unpredictable global factors on market behavior.
Key Takeaways
- Leading indicators can help forecast future market trends, offering an edge in investment decisions.
- Successful use of leading indicators entails a thorough analysis and understanding of their impact on the markets.
- Technical analysis is a pivotal aspect of employing leading indicators, requiring evaluation of their predictive reliability.
Understanding Leading Indicators
When you invest, recognizing the signals that foreshadow economic trends is vital. In this respect, leading indicators serve as a pivotal tool for insightful forecasting.
Definition and Importance
Leading indicators are statistics that precede economic movements, offering you insights before broad changes occur. They are forward-looking, and economists utilize them to forecast future economic activity. Their importance lies in their predictive quality, which can guide investment decisions by providing a glimpse of future economic health. For example, a rise in building permits might indicate an upcoming expansion in construction activity, which could influence your investment choices in related sectors.
Leading vs. Lagging and Coincident Indicators
Leading indicators should not be confused with lagging or coincident indicators. Lagging indicators measure economic activity that has already occurred, such as the unemployment rate, while coincident indicators move in line with current economic growth, such as gross domestic product (GDP). Leading indicators provide a glimpse of what is to come and help investors make informed decisions on potential market movements.
Understanding the difference between types of economic indicators is crucial for using them effectively in investing:
- Leading Indicators: Provide early signals about the direction of future economic activity. These are useful for making forward-looking decisions.
- Lagging Indicators: These reflect economic performance after trends have occurred. They’re beneficial for confirming patterns you may already suspect.
- Coincident Indicators: Move in line with the economy, offering real-time data about the current state of economic activity.
| Indicator Type | Purpose in Analysis | Example |
|---|---|---|
| Leading | To predict future trends | Increase in consumer confidence |
| Lagging | To confirm established trends | Unemployment rates |
| Coincident | To assess current economic conditions | GDP growth rate |
Using leading indicators with lagging and coincident indicators can provide a comprehensive view of economic trends, allowing you to make more informed investment decisions.
Identifying Key Leading Indicators
You must monitor leading indicators that predict economic activity to make informed investment decisions. These indicators give you a glimpse into future economic conditions and market trends, allowing you to adjust your investment strategy accordingly.
Economic Indicators
Economic indicators provide data on the general health of the economy. The Leading Economic Index (LEI), compiled by The Conference Board, comprises ten indicators designed to signal peaks and troughs in the business cycle. Within this index, pay close attention to:
- Unemployment Rate: Lower unemployment typically signals economic expansion, potentially leading to increased consumer spending and higher GDP growth.
- Consumer Confidence: When consumer confidence is high, it often precedes greater consumer spending and positive economic momentum.
- Housing Starts: A rise in new residential construction indicates a growing economy as it reflects consumer optimism and spending.
| Economic Indicators | Implications for the Economy |
|---|---|
| Unemployment Rate ↓ | Potential Economic Expansion |
| Consumer Confidence ↑ | Increased Consumer Spending |
| Housing Starts ↑ | Positive Economic Momentum |
Example: Leading Economic Indicators Chart
Using TradingView, we can plot multiple economic leading indicators to assess the interplay.

Try Leading Indicator Charts on TradingView
The chart above displays the trends of three leading economic indicators, Unemployment Rate, Consumer Confidence, and Housing Starts, over a 14-year period. The x-axis displays the timeline for the 14 years, and the y-axis displays the numerical value for each indicator. The Unemployment Rate is represented with a red line, Consumer Confidence with a green line, and Housing Starts with an orange line. As can be seen from the chart, the Unemployment Rate declined steadily while Consumer Confidence and Housing Starts trended upwards.
Financial Market Indicators
Financial market indicators can give insight into the future of securities and overall economic performance. Key financial market indicators include:
- Yield Curve: The steepness of the yield curve can imply the market’s expectations for future economic activity. An inverted yield curve, where short-term yields exceed long-term, may indicate an impending economic downturn.
- Stock Prices: Rising stock prices often reflect investor optimism and can precede economic growth, while declining prices may signal an economic slowdown.
| Financial Market Indicators | Economic Forecast |
|---|---|
| Yield Curve Inversion | Possible Economic Downturn |
| Stock Prices ↑ | Potential Economic Growth |
Example: Leading Indicators – Stock Prices
Stock market prices are a leading indicator of potential economic growth. When investors buy stocks, it usually indicates optimism about the future performance and economic outlook. Rising stock prices also tend to lead to higher consumer spending and investment in business initiatives, which can help fuel economic growth. However, declining stock market prices may suggest an impending economic slowdown or downturn. Investors need to keep track of stock market prices and other financial indicators as they can provide valuable insight into the economy’s overall health.
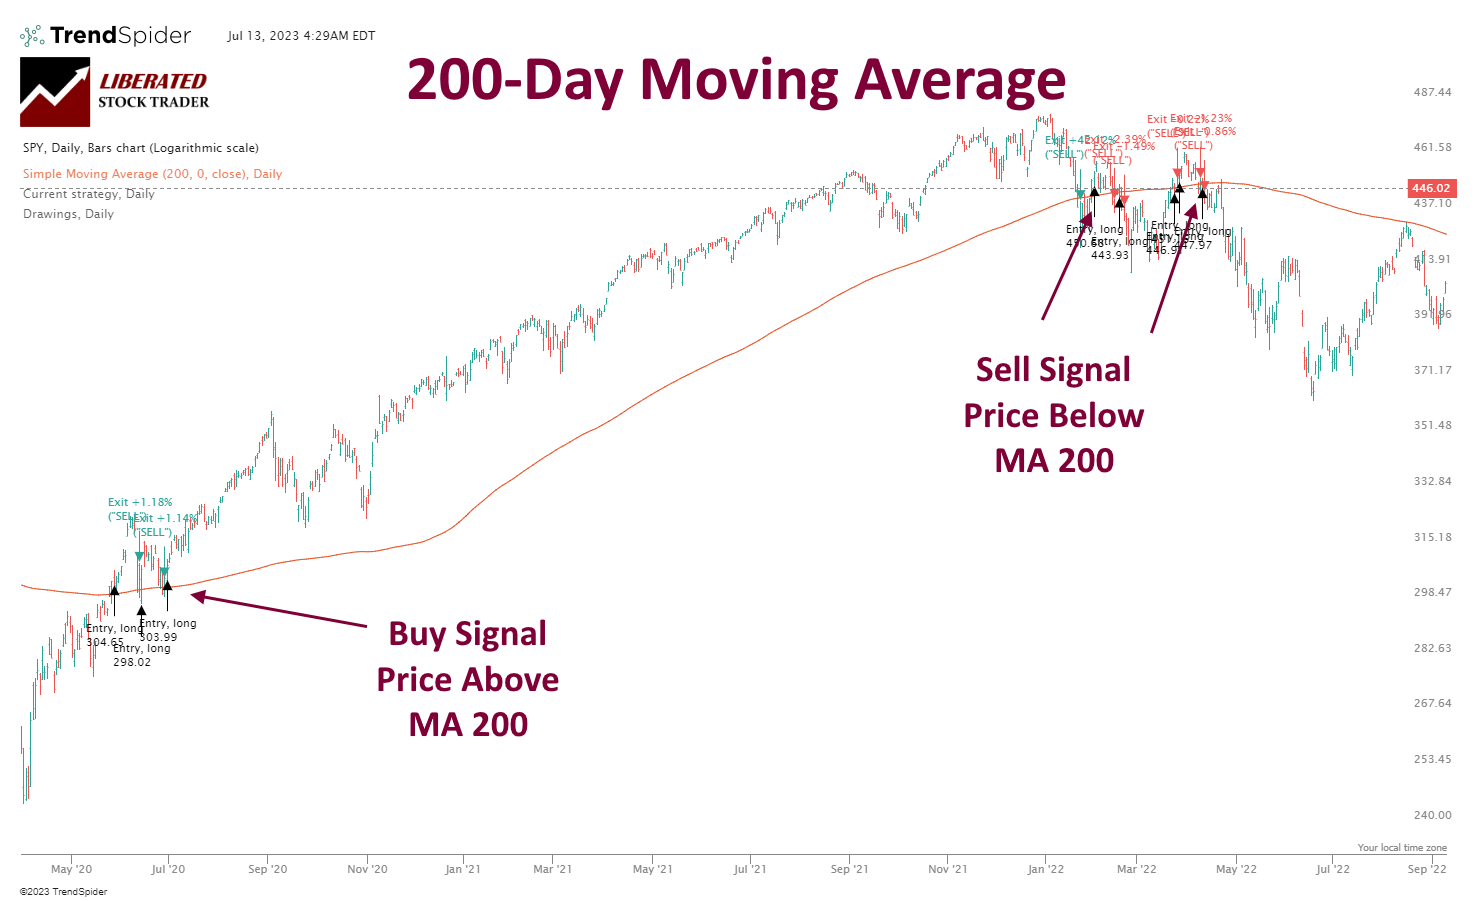
The 200-day moving average is a technical indicator that assesses a stock’s performance over the last 200 days and gives investors and traders an idea of where it has been, where it is now, and where it might be headed.
Get TrendSpider for Strategy Testing
Manufacturing and Industry Indicators
Manufacturing and industry indicators are pivotal in assessing production health and potential economic direction. Significant indicators include:
- Purchasing Managers’ Index (PMI): A PMI above 50 suggests manufacturing expansion, which correlates with overall economic growth. Below 50 can indicate contraction.
- Durable Goods Orders: Increased orders for long-lasting goods often forecast a rise in production and economic strengthening.
| Manufacturing Indicators | Economic Impact |
|---|---|
| PMI > 50 | Signaling Economic Growth |
| Durable Goods Orders ↑ | Indicative of a Stronger Economy |
In addition to the above indicators, keep an eye on initial jobless claims and money supply, as these can also provide valuable direction on future economic activity. Monitoring these leading indicators enables you to anticipate economic changes and adjust your investments before these changes take effect.
Leading Industry Indicators on TradingView
Application of Leading Indicators in Investing
When investing, your ability to anticipate market movements is often underpinned by your understanding and application of leading indicators. These are pivotal for refining your investment strategy, timing the market, and dissecting economic reports.
Incorporating Indicators in Investment Strategy
To embed leading indicators into your investment strategy, you must first identify which indicators have a historical correlation with the stocks or sectors you are targeting. For instance, the Purchasing Managers’ Index (PMI) can signal the manufacturing sector’s economic health. If you’re invested in industrial stocks, a rising PMI might suggest increased manufacturing activity and potential stock growth.
- Identify Sector-Specific Indicators: List indicators relevant to your preferred stocks.
- Review Historical Performance: Assess how changes in these indicators have correlated with stock price movements.
- Adjust Allocations: Use this insight to diversify or concentrate your portfolio in sectors likely affected by upcoming economic changes.
Market Timing and Investment Decisions
Timing the market with precision is challenging, but leading indicators can offer clues. Before the Federal Reserve adjusts interest rates, it assesses various leading indicators which can affect the stock market. By keeping an eye on indicators like jobless claims and housing starts, you can make educated guesses about interest rate decisions and position your investments accordingly.
- Interest Rate Sensitivity: Note how stocks in your portfolio might react to rate changes.
- Anticipatory Moves: Adjust your holdings before analyst consensus to capitalize on looming economic change.
Understanding and Interpreting Economic Reports
Interpreting economic reports is key for investors. Analysts pore over those expecting a hint of business trends or economic shifts. For instance, if the Federal Reserve’s Beige Book reports robust economic activity, it could presage bullish market conditions. Scrutinizing such reports enables you to anticipate market sentiment and tweak your investment approach.
- Key Reports to Watch:
- Federal Reserve’s Beige Book
- Employment Reports
- Consumer Confidence and Retail Sales Data
- Report Analysis: Break down the reports’ data and forecasts, considering how they match the current stock market valuations and trends.
Technical Analysis with Leading Indicators
When you employ technical analysis for investing, leading indicators can offer insights into future market movements. They are designed to predict price movements before they occur, providing an edge in your trading strategy.
Trend Analysis Tools
To track the direction of the stock market trend, you would use Moving Averages. This tool helps identify the direction of the market momentum before it becomes obvious to the market at large. You plot a Moving Average by calculating the average stock price over a specific period, creating a smoothed line that makes trends easier to spot.
- Support and Resistance Levels: These are crucial in trend analysis. Support levels represent the price where a downtrend could pause due to a demand concentration. In contrast, resistance levels indicate where a price may top out as supply overwhelms demand. Recognizing these levels can inform your entry and exit points.
Momentum Indicators
Momentum indicators, such as the Relative Strength Index (RSI), are pivotal in assessing the speed of price changes. The RSI, in particular, measures the magnitude of recent price changes to evaluate overbought or oversold conditions.
- Relative Strength Index (RSI): Typically set on a scale from 0 to 100, the RSI above 70 indicates that a security may be overbought, while an RSI below 30 suggests it may be oversold. This information helps you gauge potential reversals.
How the RSI Indicator Works
Volume and Price Indicators
Volume can enhance the accuracy of price predictions when combined with price movements. When prices move in a direction accompanied by high volume, it confirms the trend’s strength. The converse is also true — low volume during price changes suggests a weaker trend.
- On-balance Volume (OBV): This indicator uses volume flow to predict changes in stock price. An increasing OBV reflects positive volume pressure that can lead to higher prices. Conversely, falling OBV indicates negative volume pressure, which can signal a price decrease. Keep an eye on OBV with other indicators to validate your market predictions.
Assessing the Reliability of Leading Indicators
To successfully use leading indicators for investment purposes, you must evaluate their reliability. This involves understanding the various factors that influence performance and how to interpret historical versus current data for informed decisions.
Factors Influencing Indicator Performance
Leading indicators are forward-looking statistics that can predict future economic activity. They are the tools that help you anticipate business trends before they fully play out in the economy. However, the accuracy of these predictions is influenced by both quantitative and qualitative factors.
- Quantitative Factors: These include historical performance data, statistical noise, and correlation with economic cycles. You can often quantify these elements through mathematical models.
| Factor | Description |
|---|---|
| Statistical Noise | Refers to the randomness in data that may obscure the real signal. |
| Correlation | Measures the strength and direction of a linear relationship between two variables. |
| Economic Alignment | Examines how well the indicator tracks with corresponding economic movements. |
- Qualitative Factors: These aspects involve subjective judgment. They can range from geopolitical events to changes in consumer sentiment.
- Political and policy environment
- Market sentiment
- Technological innovation
By examining quantitative and qualitative aspects, you improve your chances of selecting indicators with consistent reliability.
Comparing Historical and Current Data
To grasp the efficacy of a leading indicator, compare its historical data to current conditions. This comparison can reveal patterns that may indicate the direction of future economic activity.
- Historical Data: Analyze periods where the indicator successfully signaled economic changes.
- Current Data: Look at the latest data against the backdrop of existing business trends and economic conditions.
By comparing the two, you can:
- Identify Consistencies: Ensure the indicator is consistent in its predictive capability over time.
- Spot Anomalies: Determine if discrepancies need further investigation, which could invalidate the indicator’s reliability.
Essentially, you’re striving to confirm that the leading indicators you rely on offer a concrete value for your predictive analysis. Remember, investment decisions should be based on indicators that can demonstrably anticipate economic shifts.
Global Leading Indicators and Market Influences
As an investor, you navigate a complex global landscape where economies intertwine, and events impact markets. Your understanding of global leading indicators and the effects of worldwide events can significantly influence your investment decisions.
International Economic Indicators
Economic indicators are critical for forecasting financial trends. Gross Domestic Product (GDP) is a broad measure of overall economic activity and health. When international GDP growth is strong, it suggests expanding economies and often signals a bullish market trend. Interest rates are another pivotal indicator; central banks such as the Federal Open Market Committee (FOMC) adjust rates to influence economic growth and inflation. Low rates typically encourage borrowing and investment, potentially stimulating the economy.
Be aware of the Consumer Price Index (CPI) and the Producer Price Index (PPI), as both can hint at upcoming inflationary or deflationary patterns. A rising CPI indicates increasing consumer costs, which can lead to tightening monetary policy. On the other hand, unemployment figures provide insight into the labor market, with decreasing unemployment often signaling an uptick in economic activity.
Moreover, consumer confidence reflects overall sentiment and can precede increases in consumer spending, which fuels economic growth. A strong economy, indicated by positive leading indicators, attracts international investment, strengthening currency values and market conditions.
Influence of Global Events on Markets
Global events can significantly impact your investments. A housing crisis in one country can lead to international banking stress, influencing global credit markets and leading to stringent loan conditions. For instance, a crisis may cause a drop in confidence and spending, leading central bankers to implement measures to stimulate the economy.
Pay attention to the minutes and announcements of key monetary policymakers such as the FOMC and other open market committees. For example, their decisions on interest rates can reverberate across global markets, influencing stock, bond, and currency prices. Economic trends punctuated by trade agreements, elections, or geopolitical conflicts can sway market conditions rapidly, affecting your investment portfolio’s value.
Track these indicators and events closely—they provide critical data for making informed decisions and understanding the nuances of global market influences.
The Future of Leading Indicators
Your understanding of leading indicators can be greatly enhanced by considering two significant areas of development: advancements in predictive analytics and the impact of technological innovation. These areas are rapidly evolving, promising a more insightful analysis of economic trends.
Advancements in Predictive Analytics
Advancements in predictive analytics are reshaping how to use leading indicators to forecast economic activity. Techniques like machine learning now allow for more complex data analysis, uncovering previously indiscernible patterns. With these improvements, economists can refine the accuracy of predictions surrounding key leading indicators such as the Consumer Confidence Index (CCI) and the Purchasing Managers’ Index (PMI).
To highlight the influence of predictive analytics on leading indicators:
- Consumer Confidence Index (CCI):
- Historic data modeling: Patterns predicting shifts in consumer spending.
- Sentiment analysis: Predictive analytics assess public sentiment to anticipate changes in the CCI.
- Purchasing Managers’ Index (PMI):
- Economic sector trends: Models identify sector-specific cyclical trends.
- Supply chain forecasting: Analytics predict disruptions and their impact on PMI.
Impact of Technological Innovation
Technological innovations are opening new horizons for using leading indicators to predict potential economic shifts. Real-time data collection devices and advanced communication networks enable a faster response to signs of economic expansion or warning signals of a recession.
Consider the following impacts of technology on leading indicators:
- Real-time Analytics:
- Institute for Supply Management (ISM) reports can now be augmented with instantaneous data streams, ensuring current reflection of market conditions.
- Beige Book: Technological tools facilitate swifter data collation and analysis, enhancing predictive quality.
- Customer Satisfaction & SEP (Survey of Economic Perspectives):
- Online feedback systems: Immediate analysis of customer satisfaction surveys, contributing to leading indicators.
- Market sentiment: Technology deciphers social media and web presence, providing a live pulse on customer attitudes feeding into SEP.
Understanding these developments can equip you with a more nuanced approach to investing, helping you better anticipate the economy’s future direction.
FAQ
What are the top leading indicators for analyzing investments?
Top leading indicators include the Purchasing Managers' Index (PMI), stock market returns, building permits, initial jobless claims, and yield curves. Monitoring these indicators can provide early insight into economic trends and potential changes in market conditions.
How can investors apply leading indicators for market timing?
Investors can use leading indicators to forecast economic expansions or contractions. By adjusting their investment strategies ahead of these changes—such as increasing their holdings in growth stocks during early economic expansion—they can capitalize on market fluctuations' timing.
What distinguishes leading from lagging indicators in investments?
Leading indicators change before the economy does, providing predictive insights. On the other hand, lagging indicators reflect changes after the economy has already begun to follow a particular trend and are used to confirm the patterns indicated by leading indicators.
How can leading indicators anticipate changes in economic cycles for investors?
Leading indicators such as business inventories, job creation rates, and consumer sentiment can signal the early phases of economic cycles. Investors observing these changes can adjust their portfolios in preparation for economic upturns or downturns.
How can I integrate leading indicators into a trading strategy?
To integrate leading indicators into a trading strategy, investors can use a combination of quantitative and qualitative analyses. Quantitative might include statistical models to predict market moves, while qualitative could involve staying informed on geopolitical events or policy changes affecting the indicators.


 Settings Tested on 43,297 Trades")

