
thinkorswim is one of the most powerful broker-connected trading platforms available to U.S. traders. In my lab testing, thinkorswim scores 4.17, slightly below the benchmark median of 4.21.
ToS is excellent for active U.S. traders who want advanced charts, options workflows, custom indicators, scanning, alerts, and live trading inside a broker-owned ecosystem. This is not a modern social charting network or AI trading assistant. thinkorswim is a trading workstation.
Lab Test Score Summary
| Test | Tier | Score | Average |
|---|---|---|---|
| Composite Lab Performance Score (CLPS) | A | 4.17 | 4.21 |
| Pricing Index | AAA | $0 | $2.74 |
| Value Score (VP) | C | 2.86 | 2.82 |
| Speed & Ease of Use | B | 3.67 | 4.50 |
| Chart Analysis Depth Index | AA | 4.33 | 3.17 |
| Chart Pattern Depth & Accuracy | B | 3.63 | 2.73 |
| Scanning Performance | B | 3.50 | 3.38 |
| Backtesting Performance | B | 3.50 | 3.38 |
| Trading Bot & Auto-Trading Reliability | B | 3.00 | 2.50 |
| AI & Algo Index | C | 1.50 | 2.00 |
| Alert Speed | A | 4.00 | 3.67 |
| Trade Signal Quality | C | 0.00 | 0.00 |
| Broker Connectivity & Ecosystem Depth | C | 2.70 | 2.00 |
| Portfolio Tool Performance | C | 2.60 | 2.80 |
| Financial News Speed & Depth | B | 3.00 | 2.80 |
| Community Utility Index (CUI) | B | 3.50 | 3.25 |
| Support Infrastructure & SLA Audit | A | 4.00 | 3.75 |
Composite Lab Performance Score (CLPS)
| Metric | Calculation | thinkorswim | High | Median | Low |
|---|---|---|---|---|---|
| Composite Lab Performance Score (CLPS) | Average for all ratings + 5X Superpower Boost for Top 5 features | 4.17 | 4.75 | 4.21 | 2.93 |
| Composite Lab Performance Score (CLPS) Overall Test Winners | TrendSpider 4.72 | Trade Ideas 4.52 |
thinkorswim scores 4.17, just under the median benchmark of 4.21. That makes it a strong but slightly uneven platform in my lab results. Its best scores are concentrated in the areas active traders care about: Chart Analysis Depth 4.33, Alert Speed 4.00, Support Infrastructure 4.00, Pattern Recognition 3.63, Scanning 3.50, and Backtesting 3.50. Its weaker areas are AI, portfolio analytics, broker breadth, and broad multi-device depth.
The overall result reflects thinkorswim’s identity: it is a broker-connected professional workstation, not a general-purpose market research website. Its superpowers include Indicator Depth 5.00, Custom Indicator Coding 5.00, Custom Code Scanning 5.00, Backtesting Speed 5.00, Flexible Coding Backtesting 5.00, Concurrent Alerts 5.00, and Live Trading 5.00. Schwab’s own educational material emphasizes exactly those workflows: charts, Stock Hacker scans, alerts, thinkScript customization, and options trading setup.




Reasons to Consider
- Excellent broker-connected trading workstation: thinkorswim scores 5.00 for Live Trading and is strongest for Schwab clients who want charts, options workflows, alerts, scans, and execution in one ecosystem.
- Powerful technical customization: Indicator Depth, Custom Indicator Coding, and Custom Code Scanning all score 5.00 and are supported by thinkScript.
- Strong alerts, support, and options workflow: Alert Speed scores 4.00, Support scores 4.00, and ToS remains one of the best U.S. platforms for active options traders.
Reasons to Avoid (or Pair With Another Tool)
- Not broker-neutral: Broker Integration scores only 0.10, because ToS is built around Schwab rather than broad multi-broker choice.
- Not AI-native: AI & Algo scores only 1.50; ToS is rules-and-scripting-driven, not a modern AI trading assistant.
- Portfolio and research depth are limited: Portfolio Tool Performance is 2.60, and Trade Signal Quality is 0.00, so long-term investors may need separate research and portfolio tools.
Verdict
thinkorswim is a powerful broker-connected trading workstation, especially for U.S. stock, ETF, futures, forex, and options traders using Schwab. In my lab testing, it scores 4.17, slightly below the overall median, but its strengths are clear: advanced charts, deep indicators, thinkScript customization, Stock Hacker scanning, fast alerts, live trading, and strong support. It is weaker in AI, broad broker choice, portfolio analytics, and beginner simplicity. I would not choose ToS as a lightweight research tool or AI platform, but for active Schwab traders—especially options traders—it remains one of the most capable free-to-access trading platforms available.
Pricing Index
| Metric | Calculation | thinkorswim | High | Median | Low |
|---|---|---|---|---|---|
| Cost-per-day | Broker-distributed platform access | Excluded / $0 platform access | $9.99 | $2.74 | $0.74 |
thinkorswim is a special pricing case because it is not sold like a normal standalone software subscription. Schwab says its clients get access to the thinkorswim platform suite for no charge, so I treat the $0 platform-access figure as excluded from paid-platform pricing comparisons rather than scoring it as a normal $0 software subscription. This avoids overstating the pricing advantage because users still face normal brokerage, data, commission, options, futures, margin, and account-related costs depending on what they trade.
The practical pricing story is still favorable. Schwab states that online listed equity trades are $0 commission and options are $0.65 per contract, which makes thinkorswim highly attractive for U.S. traders who already use Schwab as their broker. This is one reason ToS remains popular: you get an institutional-style desktop platform without paying a separate monthly software fee. But the tradeoff is that thinkorswim’s value depends on whether you want to trade through Schwab’s ecosystem.
Value Score (VP)
| Metric | Calculation | thinkorswim | High | Median | Low |
|---|---|---|---|---|---|
| Value Score | Sum of Feature Quality, Feature Depth, and Device Support Depth | 2.86 | 4.37 | 2.82 | 1.70 |
| Value Score Test Winners | TrendSpider 4.20 | Trade Ideas 4.05 |
thinkorswim scores 2.86 for Value, slightly above the benchmark median of 2.82. This is a solid result, especially because the platform is available to Schwab clients without a separate platform subscription. Strong charting, scanning, alerts, live trading, options workflows, custom coding, and support lift the value score. It is held back by device support depth and by the fact that the platform is tightly tied to one broker ecosystem rather than operating as a broad independent software marketplace.
The feature set explains why the value is strong for active traders. Schwab provides thinkorswim Desktop, web, and mobile platforms, plus educational resources for desktop setup, options trading setup, Stock Hacker, alerts, and thinkScript. The strongest value case is for U.S. stock, ETF, options, futures, and forex traders who want one broker-connected environment for analysis and execution. Long-term investors who only need portfolio research may find ToS more complex than necessary.
Speed & Ease of Use
| Metric | Calculation | thinkorswim | High | Median | Low |
|---|---|---|---|---|---|
| Speed & Use Index Rating | Average of Time to Chart Performance, Multimonitor Chart Speed, and 3 Click Rule Ease of Use | 3.67 | 5.00 | 4.50 | 3.30 |
thinkorswim scores 3.67 for Speed & Ease of Use, below the benchmark median of 4.50. The result is mixed. Time to Chart Performance and Multimonitor Chart Speed both score 4.00, which is good, but thinkorswim’s interface is dense and slower to learn than lightweight web platforms. This is a professional workstation, not a simplified chart app. The result is powerful once configured, but beginners can find the menus, tabs, order tickets, option chains, and chart settings overwhelming.
| Speed & Ease of Use Test Winners | Stock Rover 5.00 | Seeking Alpha 5.00 | TrendSpider 4.67 |
The platform’s complexity comes from its depth. Schwab’s tutorial library includes dedicated videos for desktop setup, stock trading setup, options trading setup, and mobile use, which indicates that users often need structured onboarding. That is not necessarily a flaw. For active options traders, the complexity is useful because ToS offers many workflow-specific panels and trading tools. For casual chart users, however, TradingView or StockCharts will usually feel faster and easier.
Chart Analysis Depth Index
| Metric | Calculation | thinkorswim | High | Median | Low |
|---|---|---|---|---|---|
| Chart Analysis Depth Index | Average of Chart Depth, Indicator Depth, and Custom Coding Scores | 4.33 | 5.00 | 3.17 | 0.50 |
Chart Analysis Depth is one of thinkorswim’s best categories, scoring 4.33 versus the benchmark median of 3.17. The score is driven by two perfect sub-scores: Indicator Depth 5.00 and Custom Indicator Coding 5.00. That means ToS is not merely a broker chart viewer; it is a serious technical-analysis platform with advanced studies, custom indicators, watchlist columns, scans, alerts, and conditional orders.
The key feature is thinkScript. Schwab describes thinkScript as a built-in programming language that lets users create analysis tools, including studies, watchlist columns, alerts, scan queries, and conditional orders. This explains the strong charting score: advanced users can extend ToS beyond its defaults. For traders who want programmable charts inside a broker-connected trading platform, thinkorswim is one of the strongest tools in the test.
Chart Pattern Depth & Accuracy
| Metric | Calculation | thinkorswim | High | Median | Low |
|---|---|---|---|---|---|
| Pattern Recognition Efficacy & Accuracy | Average of Pattern Recognition Depth and Accuracy Scores | 3.63 | 4.88 | 2.73 | 0.00 |
thinkorswim scores 3.63 for Chart Pattern Depth & Accuracy, comfortably above the median 2.73. The standout component is Pattern Recognition Accuracy 4.80, one of its leading lab scores. The weaker component is Pattern Recognition Depth at 2.50, meaning ToS is more reliable than it is exhaustive. In practical terms, ToS is useful for technical pattern work, but it does not match dedicated automated pattern-recognition platforms that scan hundreds of formations.
| Chart Pattern Recognition & Accuracy Test Winners | TrendSpider 4.88 | Trade Ideas 4.62 |
The feature context is important. thinkorswim’s pattern capability is best understood as part of a wider technical-analysis environment: charts, studies, scans, alerts, and thinkScript. Users can detect and monitor technical conditions, but ToS is not mainly marketed as an AI chart-pattern engine. Pattern traders will get the most value by combining built-in tools with custom scans and studies rather than expecting the platform to function like TrendSpider or other automation-first pattern scanners.
Scanning Performance
| Metric | Calculation | thinkorswim | High | Median | Low |
|---|---|---|---|---|---|
| Market Scanning Latency & Depth | Average of Scanning Speed, Criteria Depth, and Custom Code Scores | 3.50 | 5.00 | 3.38 | 0.80 |
thinkorswim scores 3.50 for Scanning Performance, slightly above the benchmark median of 3.38. The strongest scanning sub-score is Custom Code Scanning 5.00, which is crucial because advanced traders can use thinkScript logic to build specialized scans. This makes ToS far more useful than a basic screener, especially for options and technical setups. The score is solid, not category-leading, because ToS is powerful but not as fast or broad as some dedicated scanner-first platforms.
| Scanning Performance Test Winners | Stock Rover 5.00 | TrendSpider 4.67 |
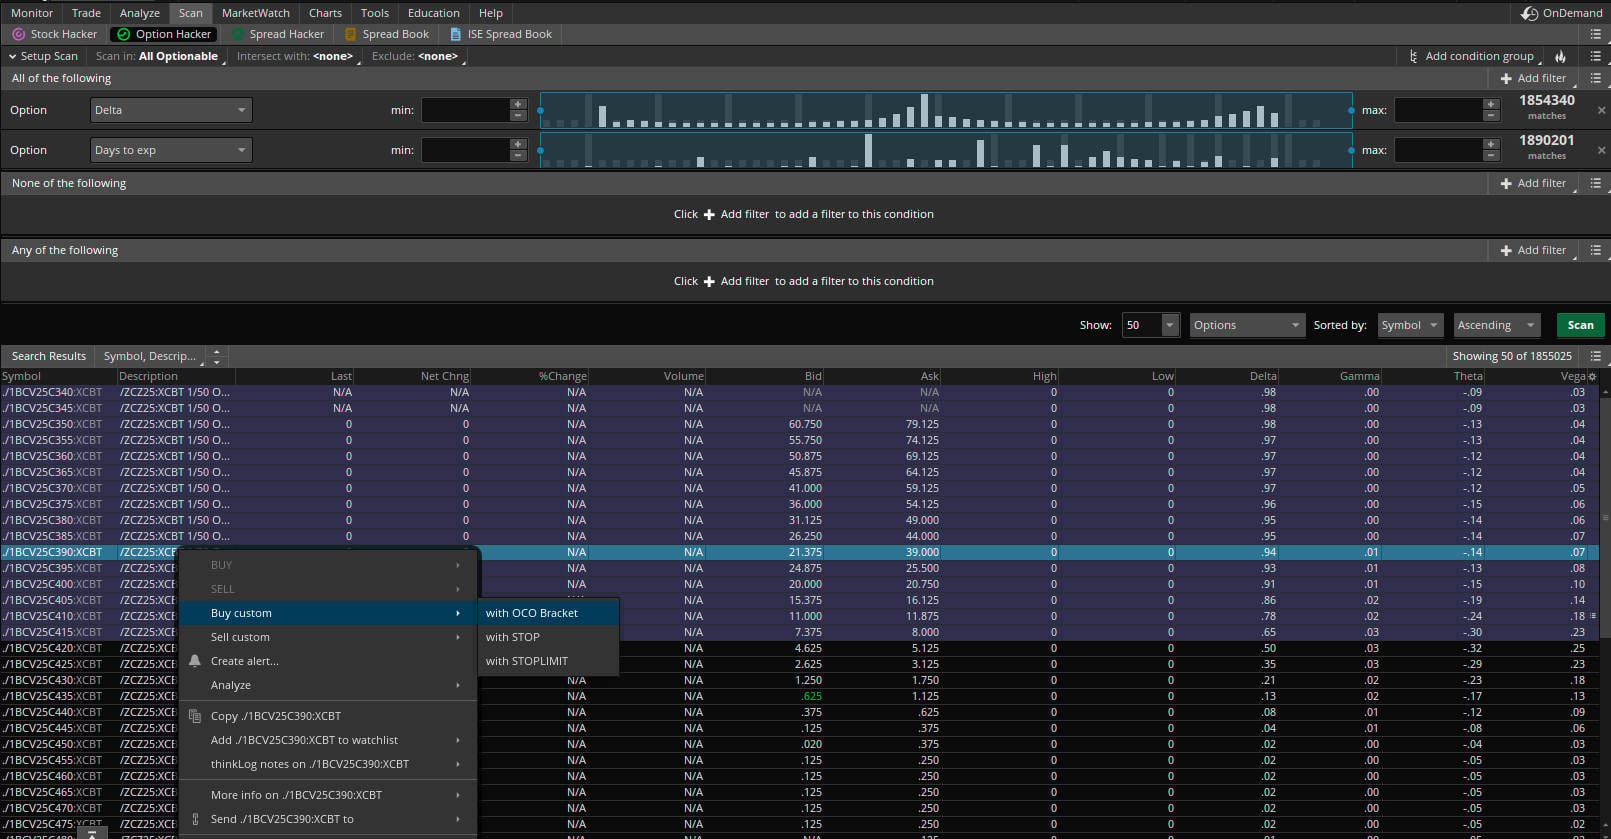
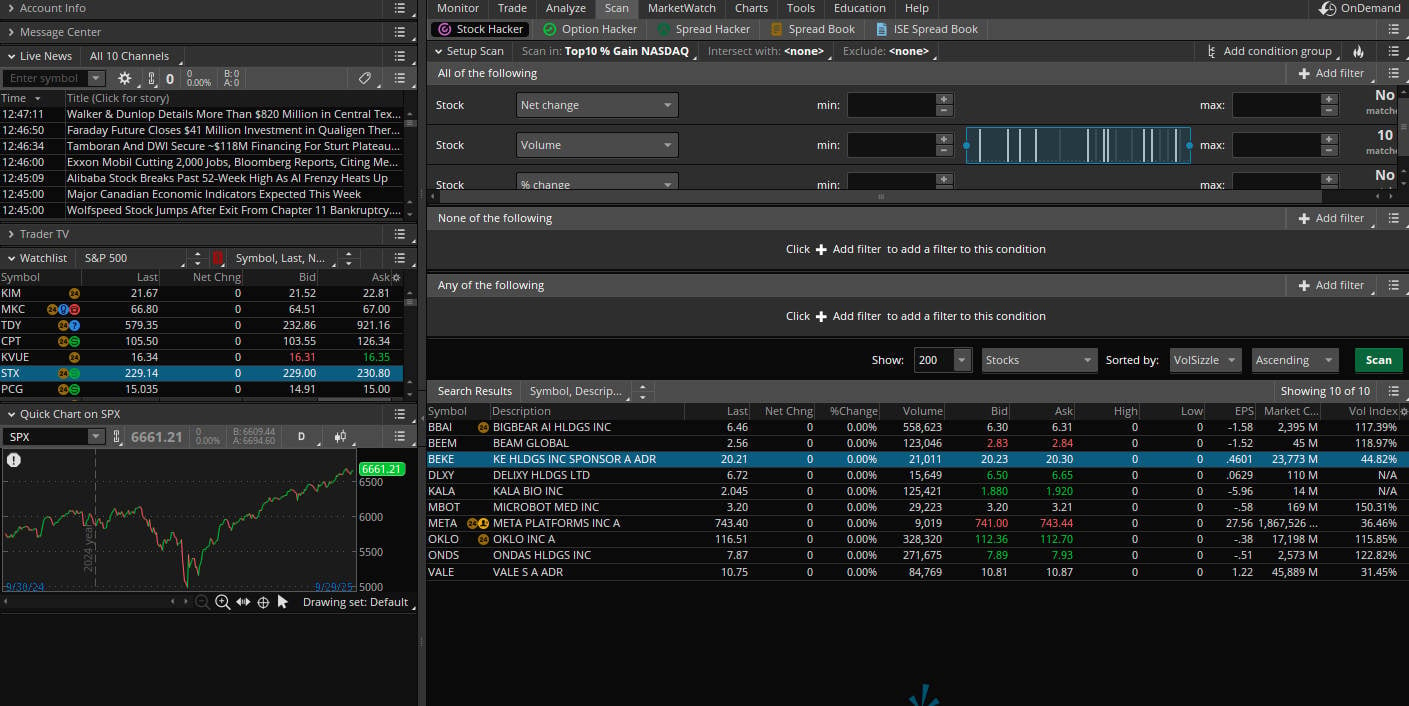
Schwab’s official education pages repeatedly highlight Stock Hacker as the core scan tool for finding candidates based on user-defined criteria. Schwab says Stock Hacker can help traders find potential trade candidates matching their criteria, and it provides examples for finding long-term holdings, bullish stocks, and technical setups. That confirms the benchmark result: ToS scanning is practical and deep enough for serious traders, especially when combined with watchlists, charts, and options tools.
Backtesting Performance
| Metric | Calculation | thinkorswim | High | Median | Low |
|---|---|---|---|---|---|
| Quantitative Backtesting Fidelity | Average of Backtesting Speed, No Coding Required, Flexible Coding, Report Quality, and Multi-Stock Backtesting Scores | 3.50 | 4.90 | 3.38 | 0.00 |
thinkorswim scores 3.50 for Backtesting Performance, slightly above the median 3.38. The standout strengths are Backtesting Speed 5.00 and Flexible Coding Backtesting 5.00, which make ToS attractive for users comfortable building logic. The major weakness is Backtesting Report Quality 0.50, which means it does not provide the kind of institutional report depth available in stronger dedicated testing platforms. This is useful backtesting, but not a full quant research lab.
| Backtesting Performance Test Winners | Optuma 4.94 | TrendSpider 4.88 | MetaStock 4.81 |
Feature-wise, thinkorswim’s testing strength comes from its scripting and paper-trading ecosystem. Schwab offers paperMoney for simulated trading through the thinkorswim platform suite, including Guest Pass access for users who want to test the platform without opening and funding an account. That makes ToS practical for learning and testing execution ideas. But strategy developers who need deep reports, basket testing, optimization, or portfolio-level simulations may want to pair it with a dedicated backtesting platform.
Trading Bot & Auto-Trading Reliability
| Metric | Calculation | thinkorswim | High | Median | Low |
|---|---|---|---|---|---|
| Automated Execution & Bot Reliability | Sum of Automation Path, Strategy/Bot Sophistication, and Operational Assurance Points | 3.00 | 4.50 | 2.50 | 1.50 |
thinkorswim scores 3.00 for Trading Bot & Auto-Trading Reliability, beating the median 2.50. This reflects strong conditional logic and broker-connected trading workflows, but not a full bot marketplace or automated strategy deployment platform. ToS can support advanced conditional orders and thinkScript-driven logic, but Schwab does not position it as a hands-off automated trading robot platform with formal public uptime guarantees.
| Bot & Auto-Trading Reliability Test Winners | TrendSpider 4.50 | Trade Ideas 4.00 | Tickeron 4.00 |
The key feature again is thinkScript. Schwab states that thinkScript can create studies, watchlist columns, alerts, scan queries, and even conditional orders. That is enough to support sophisticated rule-based workflows, but users should be careful with the “bot” label. thinkorswim is excellent for semi-automated decision support and conditional execution, especially inside Schwab’s platform. It is not a managed bot-hosting environment like specialist automation tools.
AI & Algo Index
| Metric | Calculation | thinkorswim | High | Median | Low |
|---|---|---|---|---|---|
| Algorithmic Intelligence & AI Tier Index | Sum of Algo Depth, AI Layer, and Transparency Points | 1.50 | 5.00 | 2.00 | 1.00 |
thinkorswim scores 1.50 for AI & Algo, below the median 2.00. This is not because ToS lacks sophistication; it is because the platform is deterministic and script-driven rather than AI-native. The platform is powerful for custom rules, indicators, scans, and conditional logic. Still, it does not offer a modern AI reasoning layer, a machine-learning signal engine, or an LLM-style trade assistant within the lab rubric.
| AI & Algo Index Test Winners | TrendSpider 5.00 | Trade Ideas 4.50 |
Feature-wise, this distinction matters. ToS is strong for traders who want to define logic themselves using thinkScript and then apply it to charts, scans, alerts, and orders. It is weaker for traders who want AI-generated trade ideas, model explanations, or automated signal ranking. Schwab’s materials emphasize technical tools and scripting rather than AI-native decisioning. That makes thinkorswim an advanced algorithmic workstation, but not an AI trading platform.
Alert Speed
| Metric | Calculation | thinkorswim | High | Median | Low |
|---|---|---|---|---|---|
| Alert Trigger Latency & Delivery Speed | Average of Concurrent Alerts, Alert Streams Richness, and Alert Speed Rating Scores | 4.00 | 4.67 | 3.67 | 2.33 |
Alert Speed is a strong ToS category, scoring 4.00 versus the median 3.67. The strongest component is Concurrent Alerts 5.00, while Alert Speed Rating also scores 4.00. This makes sense: active traders need alerts that monitor price, studies, option conditions, and market activity without requiring constant manual watching. ToS is well-suited to alert-heavy workflows.
| Alert Speed Test Winners | TrendSpider 4.33 | Benzinga Pro 4.33 |
Schwab’s official learning page says thinkorswim offers multiple alert types to help users keep tabs on trades and the market, and its separate scans-and-alerts material explains how to scan and set alerts for specific stocks. That explains the strong score. ToS alerting is especially useful when paired with Stock Hacker and thinkScript, allowing traders to convert technical conditions into actionable monitoring rules.
Trade Signal Quality
| Metric | Calculation | thinkorswim | High | Median | Low |
|---|---|---|---|---|---|
| Signal Alpha & Predictive Efficacy | 5 = audited specific trade signals; 2.5 = buy/sell gauges or systemic signals | 0.00 | 5.00 | 0.00 | 0.00 |
thinkorswim scores 0.00 for Trade Signal Quality because it is not being scored as an audited trade-signal provider. This does not mean ToS is weak for finding trades. It means the platform itself does not publish audited buy/sell calls under the lab definition. Users can build scans, alerts, studies, and conditional rules, but the actual trading decision is the trader’s.
| Broker Connectivity & Ecosystem Test Winners | MetaTrader 5.00 | TrendSpider 4.43 |
That distinction is important for readers. thinkorswim is a decision-support and execution platform, not a signal subscription. It gives traders powerful tools—charts, scans, options analytics, alerts, and paperMoney—but it does not replace strategy development or risk management. If a user wants a platform that issues audited trade signals, ToS is not the right fit. If they want to develop their own trading process, it is much stronger.
Broker Connectivity & Ecosystem Depth
| Metric | Calculation | thinkorswim | High | Median | Low |
|---|---|---|---|---|---|
| Asset & Data Coverage Index | Average of Live Trading, Broker Integration, and Asset/Data Coverage Scores | 2.70 | 5.00 | 2.00 | 0.67 |
thinkorswim scores 2.70, above the median 2.00, but the composition matters. Live Trading 5.00 is one of its superpowers, while Broker Integration 0.10 is one of its weakest scores. That sounds contradictory, but it is logical: ToS is deeply integrated with Schwab, but it is not a broad multi-broker platform. It is excellent if you trade through Schwab; weak if you want many broker choices.
| Portfolio Tool Performance Test Winners | Stock Rover 4.80 | Portfolio 123 4.80 | Seeking Alpha 4.30 |
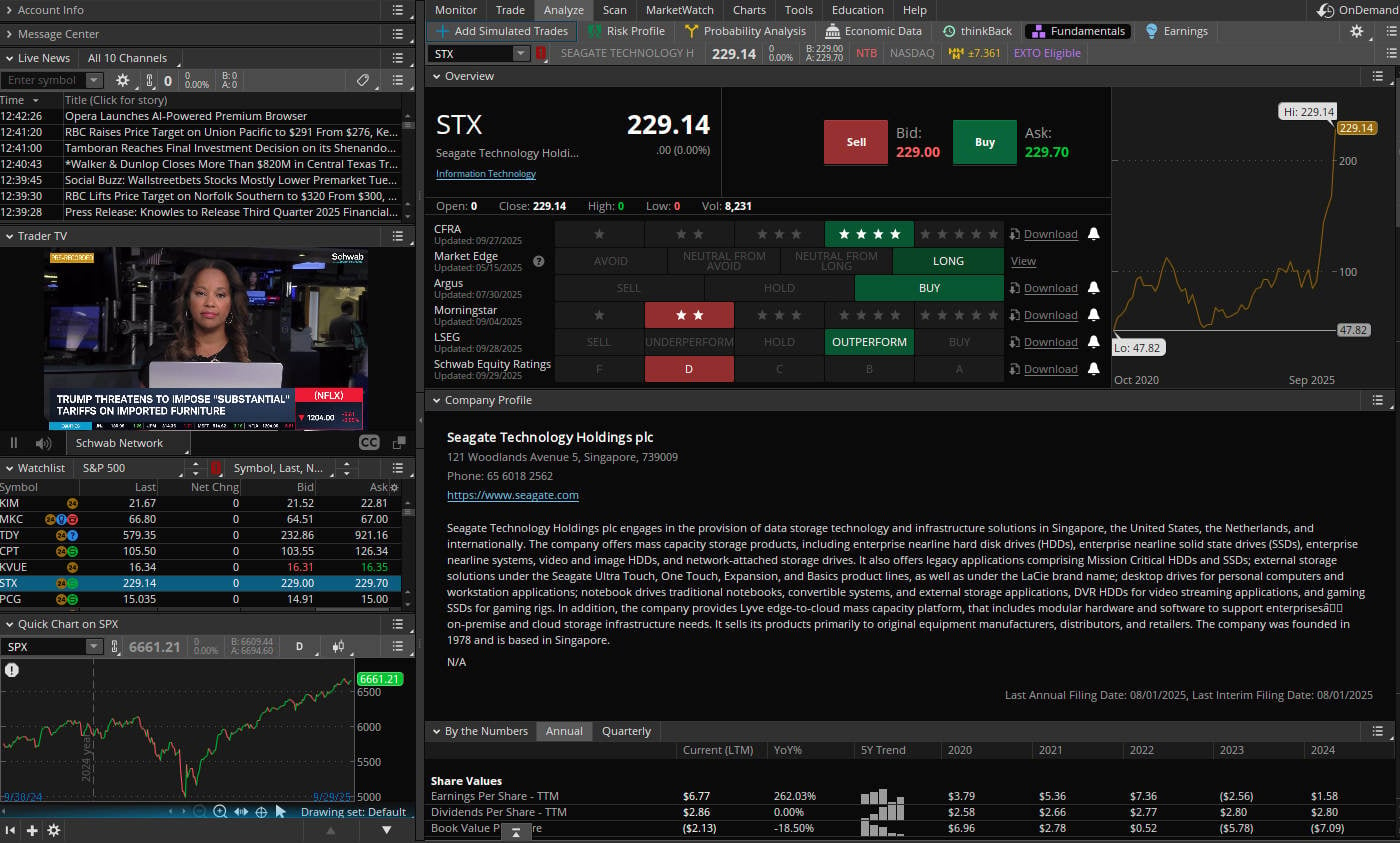
Schwab positions thinkorswim as part of its trading platform suite, with desktop, web, and mobile access. The mobile app description says users can manage positions, get quotes, access charts and studies, place trades, and access stocks, options, futures, and forex, as well as paperMoney. That makes ToS a strong broker-connected platform, especially for Schwab clients. It is not a broker-neutral trading hub like TradingView.
Portfolio Tool Performance
| Metric | Calculation | thinkorswim | High | Median | Low |
|---|---|---|---|---|---|
| Portfolio Health & Risk Analytics | Portfolio health, reporting, and risk analytics coverage | 2.60 | 4.80 | 2.80 | 2.00 |
thinkorswim scores 2.60 for Portfolio Tool Performance, slightly below the median 2.80. That is expected. ToS can manage positions, show account information, and support trading workflows, but it is not primarily a portfolio analytics platform. It does not compete with tools built around portfolio health, dividend analytics, factor exposure, correlation analysis, or long-term allocation diagnostics.
| Portfolio Tool Performance Test Winners | Stock Rover 4.80 | Portfolio 123 4.80 | Seeking Alpha 4.30 |
The feature context is broker-account visibility, not institutional portfolio analysis. Schwab’s mobile app description emphasizes managing positions, quotes, charts, studies, and trades. That is practical for active traders, but it is not deep portfolio science. Long-term investors should use Schwab’s broader account tools or a dedicated portfolio platform alongside thinkorswim if they need risk, diversification, and allocation analytics.
Financial News Speed & Depth
| Metric | Calculation | thinkorswim | High | Median | Low |
|---|---|---|---|---|---|
| Financial News Speed & Quality Rating | Weighted rubric covering news scanning, plots, watchlists, filtering, providers, alerts, and real-time delivery | 3.00 | 5.00 | 2.80 | 0.00 |
thinkorswim scores 3.00 for Financial News Speed & Depth, slightly above the median 2.80. This is useful but not elite. ToS provides market news and trading context, but it is not a dedicated real-time news terminal like Benzinga Pro, Bloomberg, eSignal, or Scanz. For most traders, ToS news is enough to support decision-making inside the platform; for news-first traders, it is not the primary edge.
| Financial News Speed & Depth Test Winners | MetaStock 5.00 | Benzinga Pro 5.00 | Scanz 5.00 |
The feature set is best interpreted as an integrated trading context. Schwab’s options education material notes that traders should monitor market events, company news, price changes, dividends, profit/loss, and expiration dates when managing positions. That aligns with the score: ToS news supports trading and position management, but the platform is not built around wire-speed headline arbitrage.
Community Utility Index (CUI)
| Metric | Calculation | thinkorswim | High | Median | Low |
|---|---|---|---|---|---|
| Community Utility Index | Average of Active Community Size and Quality of Community Contribution Scores | 3.50 | 5.00 | 3.25 | 1.75 |
thinkorswim scores 3.50 for Community Utility, above the median 3.25. Both Active Community Size and Quality of Community Contribution score 3.50, which makes sense for a platform with a long history among active traders and options users. The community is not as open-social as TradingView, but there is substantial practical knowledge around thinkScript, options setups, scans, and platform workflows.
| Community Utility Index Test Winners | MetaTrader 5.00 | Trade Ideas 4.75 |
The community value is educational and operational. Schwab publishes extensive tutorials, demos, articles, and guided platform lessons, including thinkorswim desktop introductions, scans, alerts, and Stock Hacker examples. Users also benefit from external forums and shared thinkScript examples. The result is a practical knowledge ecosystem, especially for options and technical traders, though not a global social charting community.
Support Infrastructure & SLA Audit
| Metric | Calculation | thinkorswim | High | Median | Low |
|---|---|---|---|---|---|
| Support SLA Audit: Time-to-Human Benchmarks | Average of Support Communication Channels and Support Response Time Scores | 4.00 | 5.00 | 3.75 | 1.00 |
Support is a clear thinkorswim strength, scoring 4.00 versus the benchmark median of 3.75. Both Support Communication Channels and Support Response Times score 4.00. That matters because ToS is complex: users may need help with platform setup, options chains, alerts, thinkScript, order types, mobile access, and account-specific trading questions. Strong support reduces the learning-curve penalty.
| Support Infrastructure & SLA Audit Winners | TrendSpider 5.00 | TC2000 5.00 | ThinkorSwim 4.75 |
Schwab’s scale is the advantage. The official thinkorswim ecosystem includes tutorial pages, platform demos, a support-oriented knowledge base, downloadable desktop platforms, mobile apps, and broker account support. Compared with small standalone trading software vendors, Schwab’s infrastructure provides ToS users with a more stable support path. The downside is that some support is broker- or account-dependent rather than software-developer-style technical support.
