
Our 58-point scientific TrendSpider lab test, audit, and benchmarking include speed, accuracy, value, and feature depth with data-driven precision.
TrendSpider Lab Test Results (Composite Score AAA 4.72) show a platform built for traders who want automation-first technical analysis: automated trendlines, pattern discovery, multi-timeframe logic, and no-code-to-code backtesting.
This benchmark-based lab test spans 17 categories, showing exactly where TrendSpider outperforms the average competitor and where you might want a backup tool.
Composite Lab Performance Score
TrendSpider’s AAA 4.72 composite score places it well above the median tool (4.21) and close to the high benchmark (4.75).
In practical terms, this is what I expect from a platform that’s engineered around automated technical discovery + strategy workflow rather than being “just another charting package.”
| Metric | Calculation | TrendSpider | High | Median | Low |
|---|---|---|---|---|---|
| Composite Lab Performance Score (CLPS) | Average for all ratings + 5× Superpower Boost for Top 5 killer features | 4.72 | 4.75 | 4.21 | 2.93 |
| Composite Lab Performance Score (CLPS) Overall Test Winners | TrendSpider 4.72 |
Trade Ideas 4.52 |
The composite result is carried by repeatable strengths that reduce real trading friction: pattern recognition depth/accuracy, scanning criteria depth, backtesting fidelity, AI/automation posture, alerts, and broker ecosystem coverage. The score is held back primarily by signal alpha and portfolio analytics depth.
Context: If your workflow is “find → validate → backtest → alert/automate,” TrendSpider tests like a top-tier fit. If your workflow is “portfolio health + fundamentals + allocation,” you’ll likely pair it with a portfolio-first platform.
Verdict
TrendSpider is a top-tier choice for traders who want to systematize technical analysis: automate discovery, validate ideas with backtests, then operationalize with alerts and execution plumbing.
It beats the median competitor across the categories that matter most to active technical traders—especially patterns, scanning depth, backtesting, AI/algo posture, broker ecosystem coverage, and support. But it is not the best answer for traders whose primary need is low-cost charting, portfolio analytics, or external trade signals.
TrendSpider Benchmarked Lab Scores
| Test | Tier | Score | Average |
|---|---|---|---|
| Composite Lab Performance Score | AAA | 4.72 | 4.21 |
| Pricing Index: $ per Day | A | $2.70 | $2.74 |
| Value Score (VP) | A | 4.17 | 2.82 |
| Speed & Ease of Use | AA | 4.67 | 4.50 |
| Chart Analysis Depth Index | A | 4.03 | 3.17 |
| Chart Pattern Depth & Accuracy | AAA | 4.88 | 2.73 |
| Scanning Performance | AA | 4.67 | 3.38 |
| Backtesting Performance | AAA | 4.88 | 3.38 |
| Trading Bot & Auto-Trading Reliability | AA | 4.50 | 2.50 |
| AI & Algo Index | AAA | 5.00 | 2.00 |
| Alert Speed | AA | 4.33 | 3.67 |
| Trade Signal Quality | C | 0.00 | 0.00 |
| Broker Connectivity & Ecosystem Depth | AA | 4.43 | 1.55 |
| Portfolio Tool Performance | C | 2.10 | 2.80 |
| Financial News Speed & Depth | AA | 4.50 | 2.30 |
| Community Utility Index (CUI) | B | 3.75 | 3.25 |
| Support Infrastructure & SLA Audit | AA | 4.50 | 3.75 |
Our 4.72 ⭐ Rated Trading Tool
✅ Automated Charts & Research
✅ AI Benchmark Winner
Deal Ends In:
Reasons to Consider
- Best-in-class automated technical discovery (Pattern Depth & Accuracy 4.88, 226 patterns, 95% accuracy)
- Real strategy workflow: scan → validate → backtest (4.88) → alert/automate
- Serious automation posture (Bot/Auto-Trading Reliability 4.50 + public SLA posture)
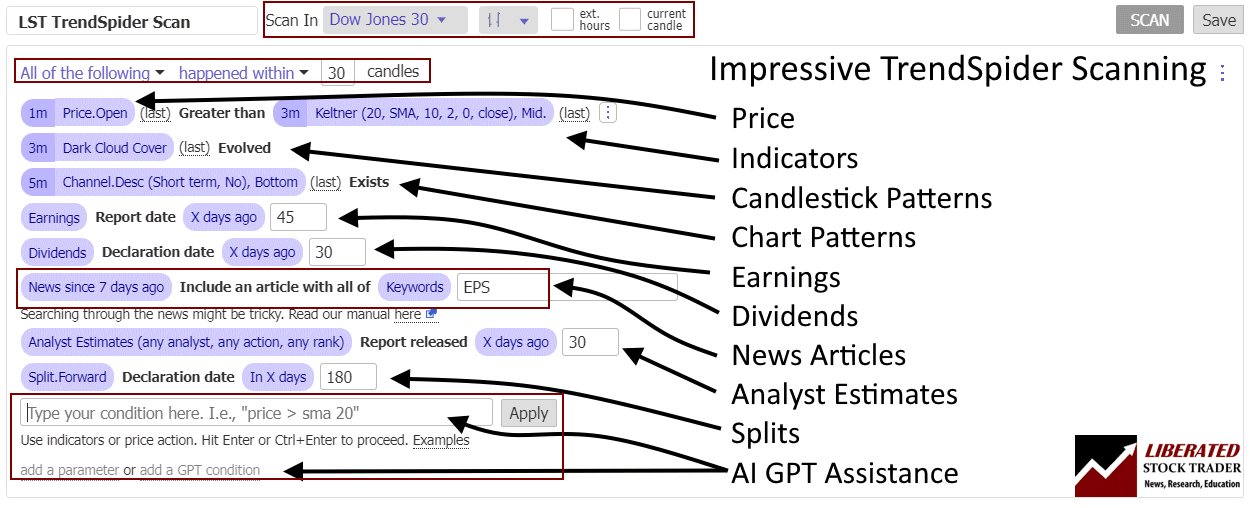
- Strong scanning depth (criteria depth + custom code scanning both maxed)
- Fast, usable trading news (Financial News 4.50)
Reasons to Avoid / Pair With Another Tool
- Portfolio analytics are shallow (Portfolio 2.10): pair with a portfolio/risk platform if you manage allocations and want deeper health/risk tooling.
- No packaged “signals feed” (Trade Signal Quality 0.00): pair with a signals provider if you want ready-made calls.

Pricing Index
TrendSpider gets an A rating for $/per day, costing $2.70. This is just below the median competitor cost of $2.74, but way below the most expensive tool at $9.99/day.
TrendSpider’s heavier computation (auto trendlines, multi-timeframe logic, automation features) explains why it rarely competes as the “cheap utility” option. The value here is less about price and more about replacing manual chart work with automated discovery. This means you get an exceptional tool for slightly less than the average price of all other software.
| Metric | Calculation | TrendSpider | High | Median | Low |
|---|---|---|---|---|---|
| Cost-per-day | $/day on an annual plan. Minimum viable plan with real-time exchange data | $2.70 | $9.99 | $2.74 | $0.74 |
| $ per feature | Effective Monthly Cost / Total Features | $5.47 | $23.37 | $5.95 | $1.94 |
| Effective Monthly Cost (EMC) | EMC = (Plan price + required real-time data fees + any required add-ons) / month | $82.00 | $303.87 | $83.82 | $22.50 |
This pricing profile is typical of specialist platforms: you’re not buying generic charting; you’re buying leading AI capability, automation depth (auto trendlines, multi-timeframe logic, pattern engines, no-code and code backtesting, alert complexity, and execution handoff tooling).
Context: Worth it for active technical traders who monetize time savings and system-building. Less compelling for casual investors or traders who only need basic charts + a lightweight screener.
Value Score (VP)
TrendSpider posts a A 4.17 Value Score versus a 2.82 median, which tells me the platform’s capability quality and breadth justify its category-leading composite score—even if it’s not the cheapest.
TrendSpider’s “feature quality” win is the headline: fewer gimmicks, more purposeful automation. It loses the overall VP crown mainly because TradingView combines very high breadth + depth with full device coverage.
| Metric | Calculation | TrendSpider | High | Median | Low |
|---|---|---|---|---|---|
| Value Score (VP) | Sum of Feature Quality (60% Weight), Feature Depth (30%) & Device Support Depth (10%) | 4.17 | 4.37 | 2.82 | 1.70 |
| Value Rank | Percentile Ranking | 4.75 | 5.00 | 2.50 | 1.00 |
| Feature Quality | Average of All Feature Quality Ratings | 4.16 | 4.16 | 2.97 | 2.00 |
| Feature Breadth | Feature richness (count of meaningful core features) | 15 | 17 | 12 | 9 |
| Feature Depth | Percentile Ranking | 4.25 | 4.75 | 3.00 | 1.00 |
| Device Support Depth | Web 2 points, (PC, Android/iOS/ 1 Point each) | 4.00 | 5.00 | 2.00 | 1.00 |
| Value Score Test Winners | TrendSpider 4.20 |
Trade Ideas 4.05 |
The sub-metrics explain why:
- Value Rank: 4.75 (high percentile positioning)
- Feature Quality: 4.16 (strong “how good is it” rating)
- Feature Breadth: 15 (meaningful core features vs 12 median)
- Feature Depth: 4.25 (depth percentile)
- Device Support Depth: 4.00 (strong cross-platform coverage)
This is a “high capability density” product: you get a lot of workflow-relevant features that connect (scan → chart automation → backtest → alerts → execution plumbing).
Context: Traders who build repeatable processes benefit most. If you use only 10–20% of the tool, you’ll feel the price more acutely.
Speed & Ease of Use
TrendSpider scores AA 4.67, ahead of the 4.25 median, and that’s the “fast” outcome for a tool that does heavy math (automation engines) without making the interface feel slow.
| Metric | Calculation | TrendSpider | High | Median | Low |
|---|---|---|---|---|---|
| Speed & Use Index Rating | Avg of Time to Chart Performance, Multimonitor Chart Speed & 3 Click Rule: Ease of Use | 4.67 | 5.00 | 4.50 | 3.30 |
| Time to Chart Speed (Seconds) | Seconds from clicking icon to loaded chart (200 bars + 2 indicators) | 2.36 | 17.03 | 4.70 | 1.60 |
| Time to Chart Performance | Points (<5s=5; <10=4.5; <15=4; <20=3) | 5.00 | 5.00 | 4.50 | 3.00 |
| Multi-Chart Latency (ms) | Delay when syncing 4 charts | 184 | 667 | 209 | 10 |
| Multimonitor Chart Speed | Multi-chart sync points | 4.00 | 5.00 | 3.50 | 0.00 |
| 3-Click Rule Test | Clicks to place a trade or launch a scan | 2 | 6 | 3 | 2 |
| 3 Click Rule: Ease of Use | 3-click points | 5.00 | 5.00 | 3.25 | 0.30 |
| Speed & Ease of Use Test Winners | Stock Rover 5.00 |
Seeking Alpha 5.00 |
TrendSpider 4.67 |
Key lab components:
- Time to Chart Speed: 2.36 seconds (fast load)
- Time to Chart Performance: 5.00 (top-tier points)
- Multi-Chart Latency: 184 ms (better than 209 ms median)
- Multimonitor Chart Speed: 4.00 (solid)
- 3-Click Rule Test: 2 clicks (excellent)
- 3-Click Ease of Use Points: 5.00
TrendSpider’s performance profile is “heavier load due to AI/automated trendline math,” which aligns with the slightly slower multi-chart sync compared to the fastest native desktop tools. The upside is that you’re trading a small amount of latency for meaningful automation—especially if you use its detection and workflow layers daily.
Context: Active traders who live in multi-chart layouts and rotate through symbols benefit. If you only open charts occasionally, speed won’t be a deciding factor.
Chart Analysis Depth Index
TrendSpider scores A 4.03, above the 3.17 median, driven by a balanced combination of chart types, indicator depth, and—critically—custom indicator capability.
TrendSpider’s differentiator is not “more chart types,” it’s what the platform does with the chart (automation overlays and multi-timeframe logic). Its scripting availability keeps it in the top tier, even if TradingView still leads on total depth and ecosystem scale.
| Metric | Calculation | TrendSpider | High | Median | Low |
|---|---|---|---|---|---|
| Chart Analysis Depth Index | Avg of Chart Depth, Indicator Depth & Custom Coding scores | 4.03 | 5.00 | 3.17 | 0.50 |
| Chart Types | Total count | 12 | 38 | 10 | 1 |
| Chart Depth | 0.3 points per chart type | 3.60 | 5.00 | 3.00 | 0.30 |
| Indicators | Total count | 140 | 400 | 116 | 0 |
| Indicator Depth | 0.025 points per indicator | 3.50 | 5.00 | 2.90 | 0.00 |
| Custom Indicator Coding | Available = 5 points | 5.00 | 5.00 | 2.50 | 0.00 |
Lab inputs:
- Chart Types: 12 (above 10 median)
- Chart Depth Points: 3.60
- Indicators: 140 (above the 116 median)
- Indicator Depth Points: 3.50
- Custom Indicator Coding: 5.00 (full points)
This is where TrendSpider differentiates: it doesn’t just provide charts; it provides automation-aware charting (e.g., distinctive charting like Raindrop charts) that supports systematic workflows.
Context: Great for technical traders who want a charting environment that integrates with scanning, alerts, and backtesting. If you want purely discretionary drawing tools and a minimal interface, you may prefer a simpler charting-first platform.
Chart Pattern Depth & Accuracy
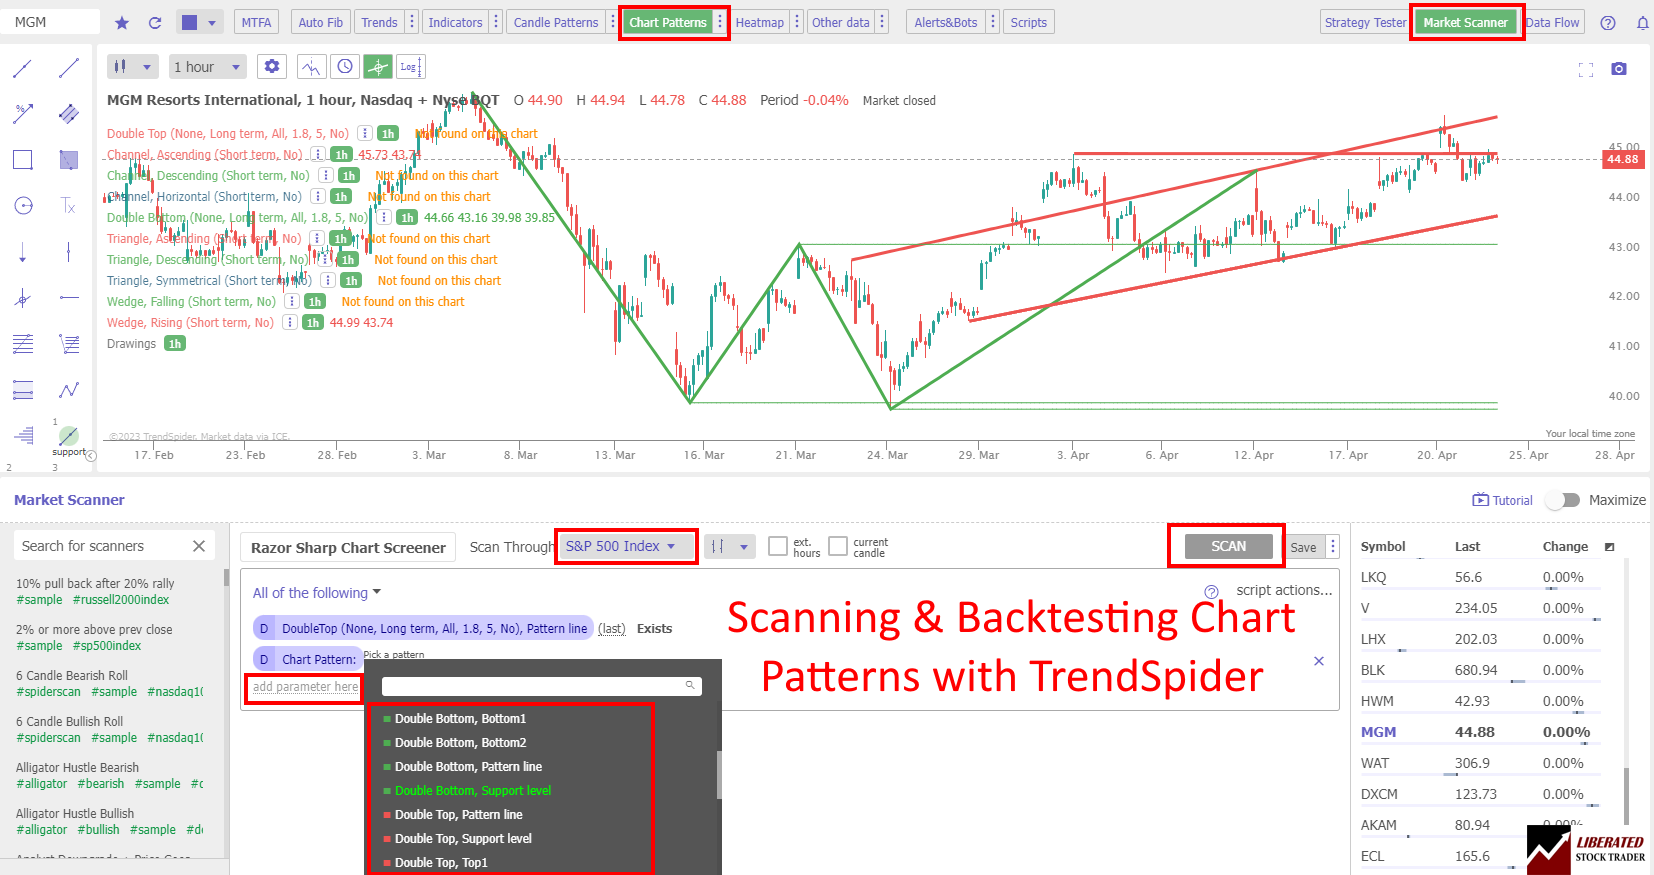
This is TrendSpider’s flagship lab result: AAA 4.88, far above the 2.73 median, and essentially at the high watermark benchmark. In live workflows, this matters because it reduces the “manual grind” of finding and validating setups across many symbols/timeframes.
| Metric | Calculation | TrendSpider | High | Median | Low |
|---|---|---|---|---|---|
| Pattern Recognition Efficacy & Accuracy | Avg of Pattern Recognition Depth & Accuracy scores | 4.88 | 4.88 | 2.73 | 0.00 |
| Total Patterns | Count of unique patterns recognized | 226 | 226 | 57.5 | 0 |
| Pattern Recognition Depth | 0.33 points per pattern recognized | 5.00 | 5.00 | 1.90 | 0.00 |
| Candle Patterns Recognized | Count | 172 | 172 | 20 | 0 |
| Chart Price & Trend Patterns Recognized | Count | 54 | 54 | 16 | 0 |
| Accuracy | Percent accurate | 95% | 95% | 89% | 0% |
| Pattern Recognition Accuracy | 0.05 point per 1% accurate | 4.75 | 4.75 | 4.48 | 0.00 |
| Chart Pattern Recognition & Accuracy Test Winners | TrendSpider 4.88 |
Trade Ideas 4.62 |
In my audit notes, TrendSpider is explicitly the “industry leader in automated technical discovery,” and the numbers back it up: it leads in library size and depth while maintaining top-tier accuracy. If automated pattern discovery is your primary buying reason, this is where TrendSpider separates from the pack.
Test components:
- Total Patterns: 226 (vs 57.5 median)
- Pattern Recognition Depth Points: 5.00
- Candle Patterns: 172
- Chart/Trend Patterns: 54
- Accuracy: 95%
- Accuracy Points: 4.75
The combination of scale (226 patterns) and measured accuracy (95%) is why TrendSpider routinely tests as an automation leader in technical discovery.
Context: Best fit for traders who want systematic, repeatable pattern workflows across a watchlist/universe. Less useful for traders who distrust pattern engines and prefer fully manual discretionary interpretation.
Scanning Performance
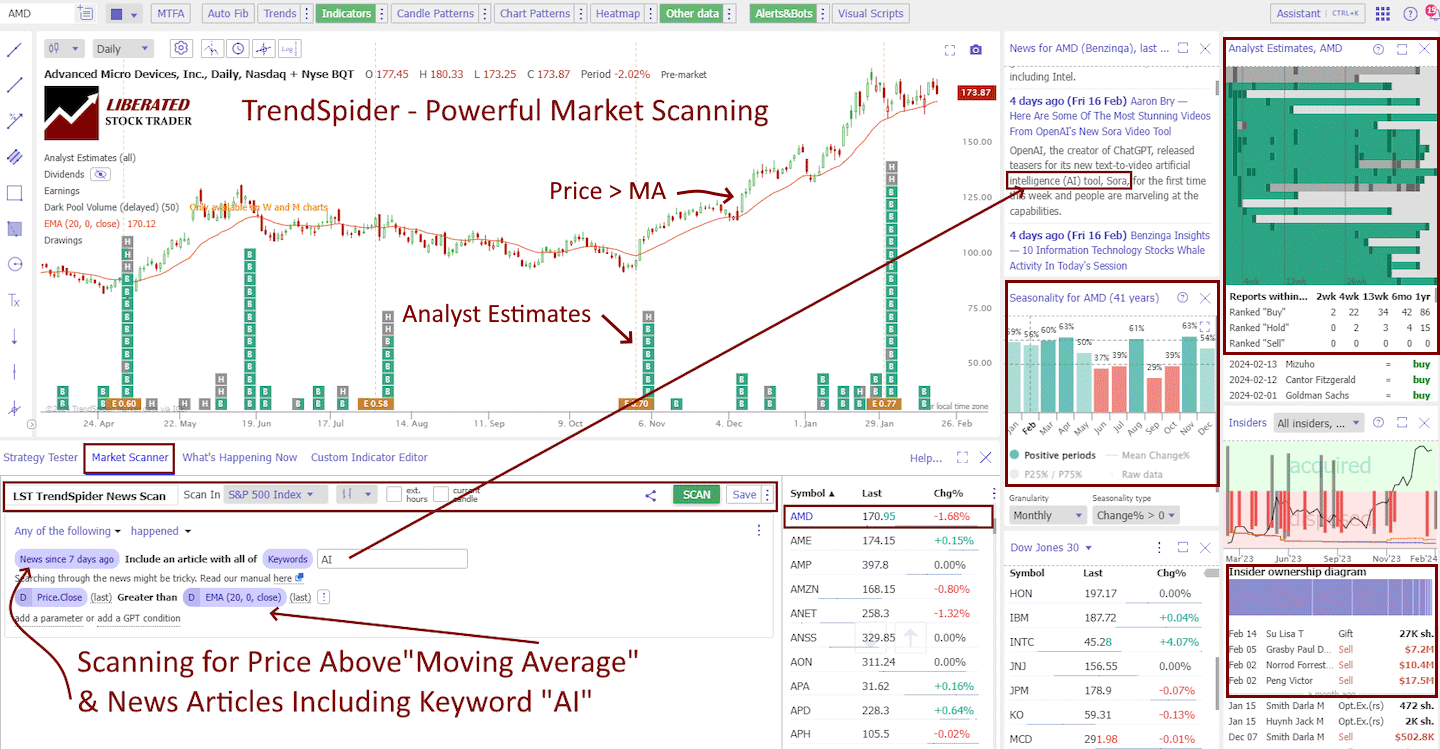
TrendSpider scores AA 4.67, versus a median of 3.38. The key takeaway is that TrendSpider is very fast; it’s built for depth: criteria richness plus custom logic.
| Metric | Calculation | TrendSpider | High | Median | Low |
|---|---|---|---|---|---|
| Market Scanning Latency & Depth | Avg of Scanning Speed, Criteria & Custom Code scores | 4.67 | 5.00 | 3.38 | 0.80 |
| Scanner Performance (ms) | Milliseconds to scan S&P 500 across 5 criteria | 375 | 2500 | 300 | 7 |
| Scanning Speed (ms) | Points (<100=5; <200=4.5; <500=4; <1000=3; <2000=2) | 4.00 | 5.00 | 4.00 | 1.00 |
| Scanner Auto-Refresh Rate (seconds) | Auto-refresh speed (not scored) | — | 60 | 1 | 0 |
| Scanning Criteria & Depth | Total criteria count | 420 | 675 | 200 | 30 |
| Scanning Criteria & Depth | Points (0.0125 points per criteria) | 5.00 | 5.00 | 2.50 | 0.80 |
| Custom Code Scanning | Exists = 5 points | 5.00 | 5.00 | 5.00 | 0.00 |
| Scanning Performance Test Winners | Stock Rover 5.00 |
TrendSpider 4.67 |
In my audit notes, the key caveat for TrendSpider scanning is “no auto refresh,” which matters for traders who live on constant real-time scanning. Where it excels is scan depth and programmability—so it’s ideal for building rich criteria sets and alert logic, even if you are not refreshing the universe every second.
Lab inputs:
- Scanner Performance: 375 ms (vs 300 ms median; still in a strong points band)
- Scanning Speed Points: 4.00
- Scanning Criteria Count: 420 (vs 200 median)
- Scanning Criteria Points: 5.00
- Custom Code Scanning: 5.00
- Auto-refresh: Not scored; audit note indicates no auto-refresh
The real advantage here is search expressiveness: 420 criteria and custom-code scanning let you formalize your edge rather than hunt manually.
Context: Traders who design scans (and iterate on them) benefit most. If you require continuous auto-refresh scanning as a core requirement, verify the fit carefully, as the audit notes flag that limitation.
Backtesting Performance
TrendSpider scores AAA 4.88, significantly above the 3.38 median, and close to the high benchmark. This category is about turning ideas into evidence without friction.
In my audit notes, TrendSpider is one of the clearest “no-code backtesting” leaders, and it pairs that with top reporting quality. It narrowly trails Portfolio123 on the composite only because Portfolio123 is a quant-first research environment, while TrendSpider is a trader-first automation platform.
| Metric | Calculation | TrendSpider | High | Median | Low |
|---|---|---|---|---|---|
| Quantitative Backtesting Fidelity | Avg of Speed, No-Code, Flexible Coding, Report Quality, Basket Backtesting | 4.88 | 4.90 | 3.38 | 0.00 |
| Backtesting Speed (ms) | Time to run 10y daily or ~2 months 5-min simulation | 167 | 6000 | 302 | 7 |
| Backtesting Speed | Points (<200=5; <500=4.5; <10000=4; <20000=3) | 4.50 | 5.00 | 4.25 | 0.00 |
| No Coding Required | Zero-code backtesting (5 points) | 5.00 | 5.00 | 5.00 | 0.00 |
| Flexible Coding Backtesting | Exists = 5 points | 5.00 | 5.00 | 5.00 | 0.00 |
| Backtesting Report Quality | Report quality percent | 100% | 100% | 70% | 0% |
| Backtesting Report Quality | Points (0.05 points per 1%) | 5.00 | 5.00 | 2.25 | 0.00 |
| Multi-Stock Basket Backtesting | If exists = 5 points | 5.00 | 5.00 | 5.00 | 0.00 |
| Backtesting Performance Test Winners | Optuma 4.94 |
TrendSpider 4.88 |
MetaStock 4.81 |
What drove the score:
- Backtesting Speed: 167 ms (excellent)
- Speed Points: 4.50
- No Coding Required: 5.00
- Flexible Coding Backtesting: 5.00
- Report Quality: 100% → 5.00
- Multi-Stock Basket Backtesting: 5.00
This is exactly the profile I want: you can prototype quickly with no-code tools, then escalate to coded logic when needed—without switching platforms.
Context: Systematic traders, strategy developers, and “prove it before I trade it” users benefit. If you never backtest, you’re leaving one of TrendSpider’s strongest advantages unused.
Trading Bot & Auto-Trading Reliability
TrendSpider scores AA 4.50, versus a median of 2.50, which is a major separation. Importantly, this measure is not “AI hype”—it’s about whether there’s a credible path from analysis to automation with operational assurances.
In my audit notes, TrendSpider’s reliability posture stands out because it pairs automation tooling with an explicit SLA stance (“Trader’s Bill of Rights” and credit posture). This is one of the few platforms where automation isn’t just “possible”—it is treated as a reliability-controlled product.
| Metric | Calculation | TrendSpider | High | Median | Low |
|---|---|---|---|---|---|
| Automated Execution & Bot Reliability | Sum of Automation Path, Sophistication, Operational Assurance | 4.50 | 4.50 | 2.50 | 0.00 |
| Automation Path | 0.5 none; 1.0 alerts; 1.5 webhook/API; 2.0 native/broker-linked execution | 1.50 | 2.00 | 1.00 | 0.00 |
| Strategy/Bot Sophistication | 0.5 simple; 1.0 multi-condition; 1.5 scripting+test; 2.0 bot-platform depth | 2.00 | 2.00 | 1.50 | 0.00 |
| Operational Assurance | 0.5 public status; 1.0 explicit SLA/credits/uptime promise | 1.00 | 1.00 | 0.00 | 0.00 |
| Bot & Auto-Trading Reliability Test Winners | TrendSpider 4.50 |
Trade Ideas 4.00 |
Tickeron 4.00 |
TrendSpider publicly positions an SLA (“Trader’s Bill of Rights”) and provides incident-linked credit language and a status channel, both of which are rare in retail trading tooling.
Sub-metrics:
- Automation Path: 1.50 (alerts → webhook/API handoff)
- Strategy/Bot Sophistication: 2.00 (high sophistication)
- Operational Assurance: 1.00 (explicit SLA + incident posture)
TrendSpider publicly positions an SLA (“Trader’s Bill of Rights”) and provides incident-linked credit language and a status channel, both of which are rare in retail trading tooling.
Context: Best for traders who want to automate execution plumbing (even if execution is routed via external connectors). If you require native, broker-side algorithmic execution inside the same platform, confirm your exact workflow requirements.
AI & Algo Index
TrendSpider scores a perfect AAA 5.00, well above the median of 2.00. The lab framing here is: does AI/algorithmic intelligence materially improve decision workflows with enough transparency and practical utility?
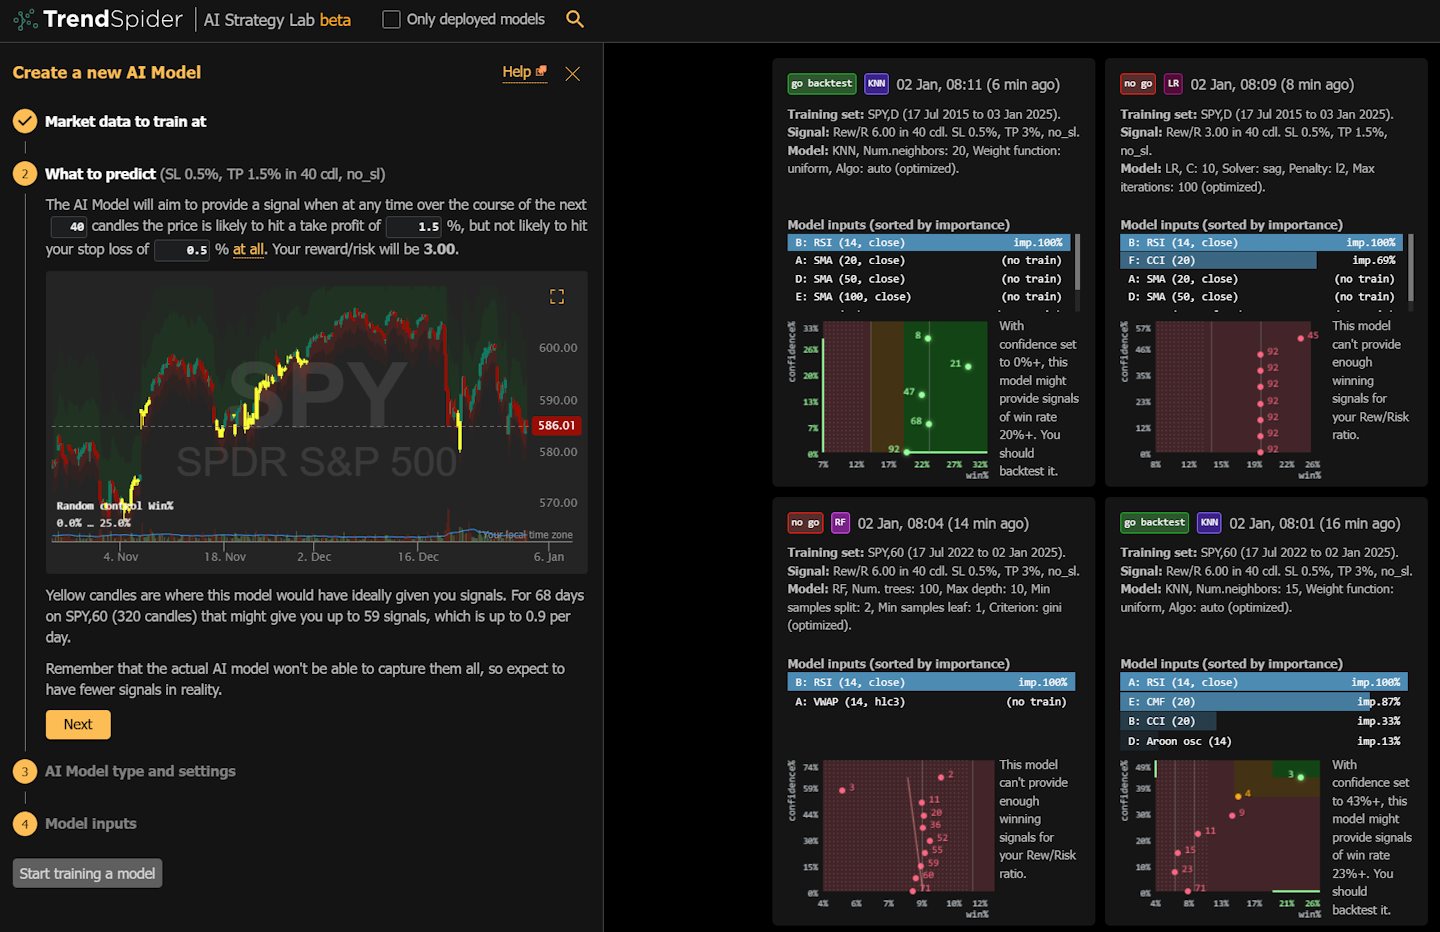
In my audit notes, TrendSpider’s edge is that the AI/automation layer is not an add-on; it’s central to the workflow (strategy lab, automated reasoning overlays, execution bridge). That is why it reaches the maximum 5.00 where many tools top out as “strong algorithms, no AI layer.”
| Metric | Calculation | TrendSpider | High | Median | Low |
|---|---|---|---|---|---|
| Algorithmic Intelligence & AI Tier Index | Sum of Algo Depth, AI Layer & Transparency points | 5.00 | 5.00 | 2.00 | 1.00 |
| Algo Depth | 0.5 alerts only; 1.0 rules strategies; 1.5 backtesting+factor/portfolio rules; 2.0 advanced quant platform | 2.00 | 2.00 | 1.50 | 1.00 |
| AI Layer | 0.0 none; 1.0 assistive; 1.5 ML signals core; 2.0 AI-native decisioning | 2.00 | 2.00 | 0.00 | 0.00 |
| Transparency | 0.0 black-box; 0.5 some; 1.0 clear methodology + validation artifacts | 1.00 | 1.00 | 1.00 | 0.00 |
| AI & Algo Index Test Winners | TrendSpider 5.00 |
Trade Ideas 4.50 |
Scored components:
- Algo Depth: 2.00
- AI Layer: 2.00
- Transparency: 1.00
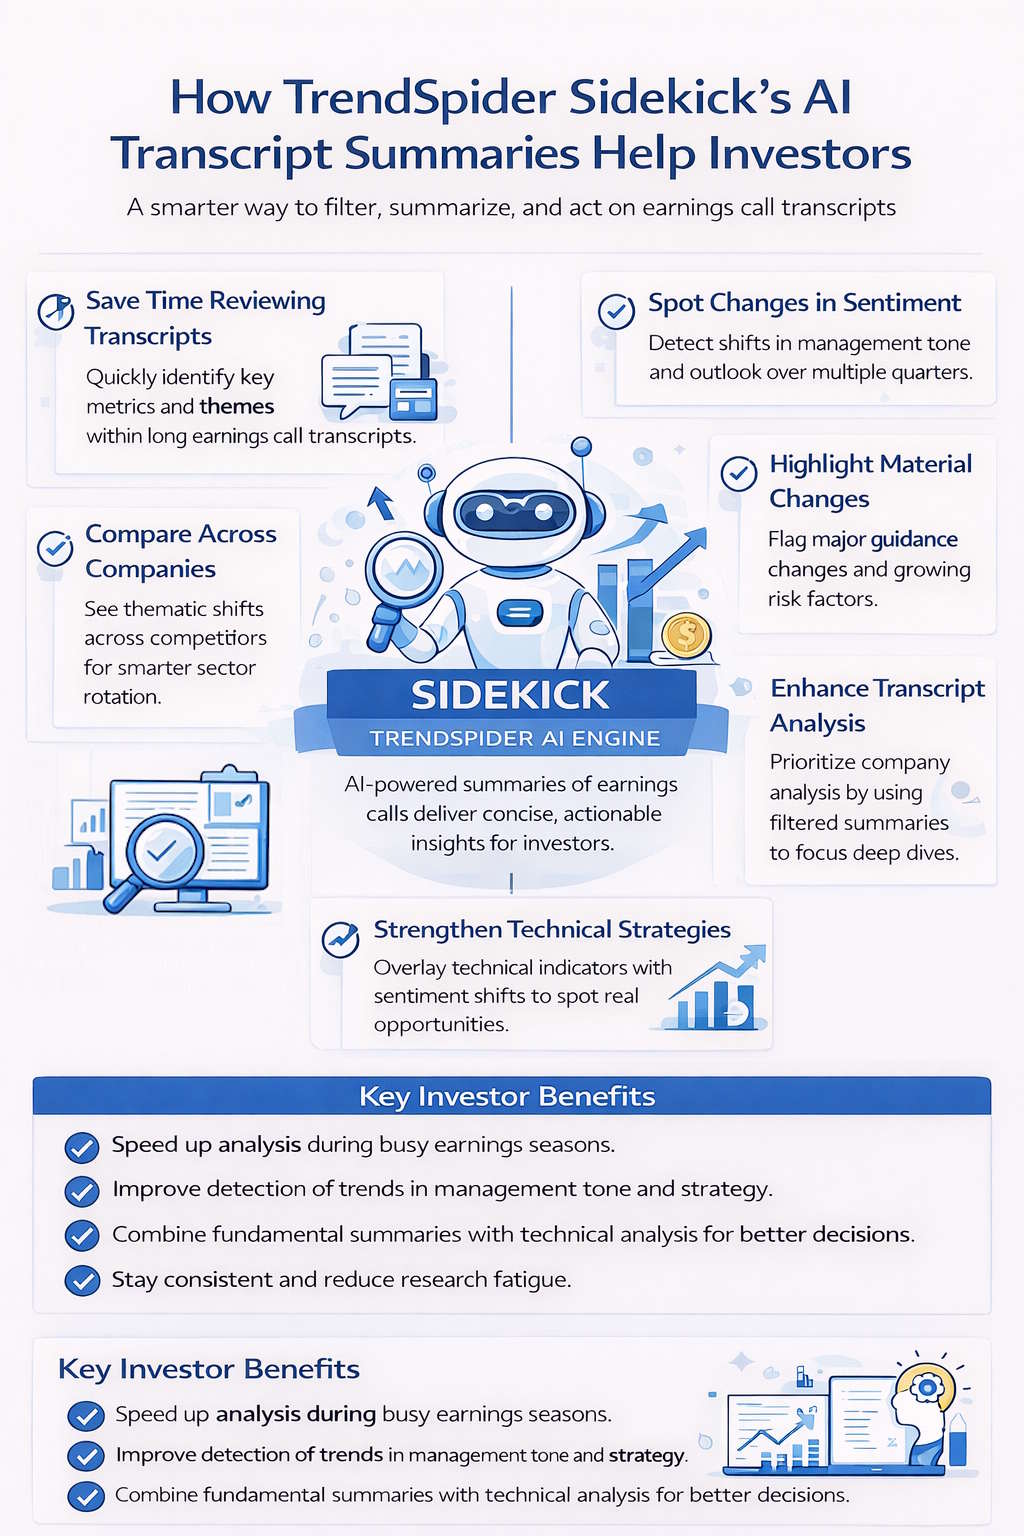
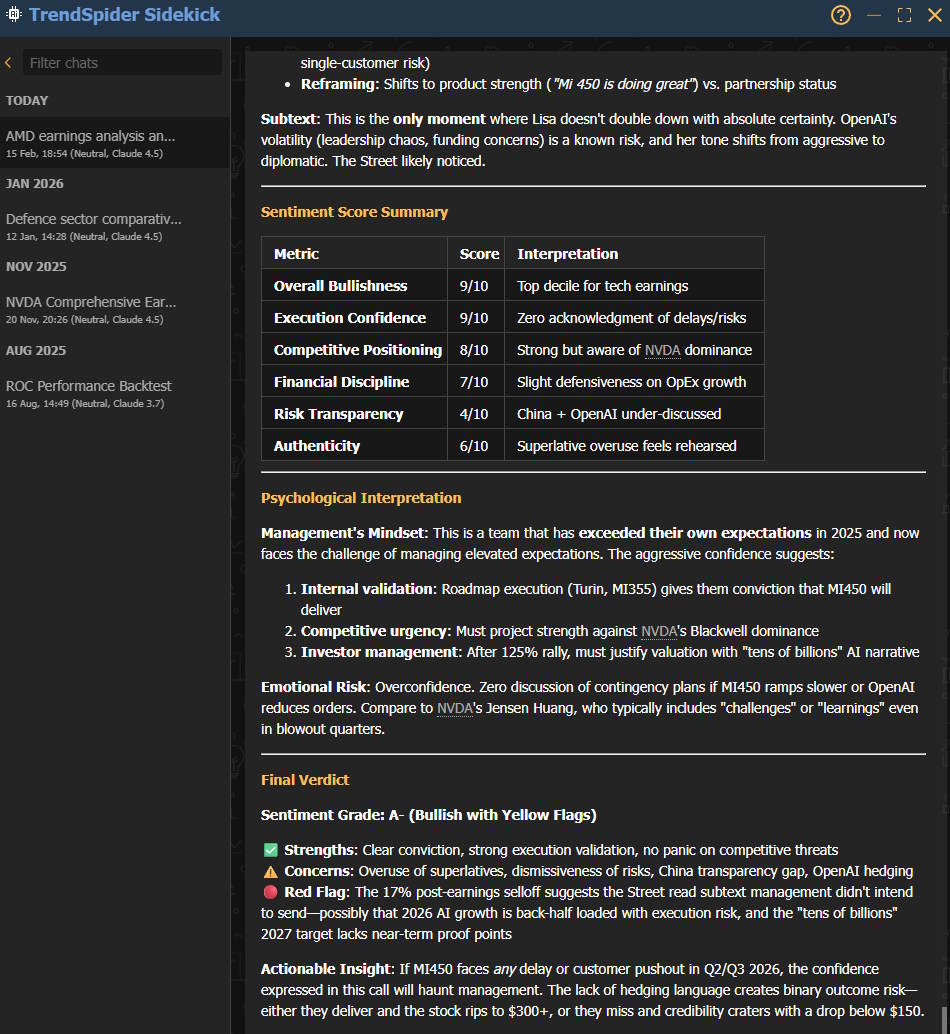
Practically, TrendSpider’s AI posture is not “chat for chat’s sake.” It’s embedded into strategy design workflows (e.g., building strategies, explaining logic, and enhancing technical discovery). This aligns with the platform’s broader “automation-first” identity.
Context: Traders who want assistance building, testing, and operationalizing strategies benefit most. Traders who want fully explainable, conservative, non-AI workflows can treat AI features as optional.
Alert Speed
TrendSpider’s AA 4.33 score beats the 3.67 median, primarily on alert capacity + delivery channel richness, with a mid-pack “latency rating” component.
In my audit notes, TrendSpider’s alerting is strongest on delivery breadth (it is the only tool here that maxes the alert-stream richness score). The trade-off is cadence/speed rating versus the “newsroom” tools and real-time scanner-first platforms, which are optimized for catalyst reaction.
| Metric | Calculation | TrendSpider | High | Median | Low |
|---|---|---|---|---|---|
| Alert Trigger Latency & Delivery Speed | Avg of Concurrent Alerts, Alert Streams & Alert Speed Rating scores | 4.33 | 4.67 | 3.67 | 2.30 |
| Concurrent Alerts | 1 point per 50 (max 5 points) | 5.00 | 5.00 | 5.00 | 5.00 |
| Concurrent Alert Count | Raw capacity | 400 | 2000 | 875 | 400 |
| Alert Streams Richness | 1 point per stream (email/webhook/SMS/app; max 5) | 5.00 | 5.00 | 2.00 | 1.00 |
| Alert Speed Rating | Speed rating points | 3.00 | 5.00 | 3.00 | 1.00 |
| Alert Speed Test Winners | TrendSpider 4.33 |
Benzinga Pro 4.33 |
Lab drivers:
- Concurrent Alerts Points: 5.00 (count context: 400 in the dataset tier framing)
- Alert Streams Richness: 5.00 (push/email/SMS/webhooks, multi-factor)
- Alert Speed Rating: 3.00 (minute-level evaluation context)
The operational takeaway: TrendSpider is strong at building complex alert logic and routing those alerts to action channels—including webhooks for automation handoff.
Context: Traders running multi-condition systems and needing routing (especially webhooks) benefit. Ultra-low-latency execution traders should validate end-to-end timing from signal → delivery → broker.
Trade Signal Quality
TrendSpider scores C 0.00, matching the 0.00 median, because this lab category is reserved for platforms that publish auditable, specific trade signals (or a formal “buy/sell gauge” system) that can be tested independently.
| Metric | Calculation | TrendSpider | High | Median | Low | Category Winner |
|---|---|---|---|---|---|---|
| Signal Alpha & Predictive Efficacy | 5 points = audited specific trade signals; 2.5 = buy/sell gauges/systemic signals | 0.00 | 5.00 | 0.00 | 0.00 | Trade Ideas, Tickeron, Motley Fool, Seeking Alpha |
In my audit notes, TrendSpider is positioned as automation tooling (discovery, strategy workflows, alerting), not as a vendor of audited, standalone “trade calls.” If you want curated signal streams, the category winners are purpose-built for that.
Context: If you want out-of-the-box daily trade calls, pair TrendSpider with a dedicated signals provider. If you want to build and validate your own edge, this score is not a deal-breaker.
Broker Connectivity & Ecosystem Depth
TrendSpider scores AA 4.43, far above the 2.00 median, indicating a strong ecosystem posture: live trading support, meaningful broker coverage, and full asset/data coverage.
| Metric | Calculation | TrendSpider | High | Median | Low |
|---|---|---|---|---|---|
| Asset & Data Coverage Index | Avg of Live Trading, Broker Integration & Asset/Data Coverage | 4.43 | 5.00 | 2.00 | 0.67 |
| Live Trading | 5 points | 5.00 | 5.00 | 5.00 | 0.00 |
| Total number of brokers integrated | Raw broker count | 33 | 1200 | 2 | 0 |
| Broker Integration | 0.1 point per broker (max 5 points) | 3.30 | 5.00 | 0.20 | 0.00 |
| Asset & Data Coverage | Stocks, Options, FX, US Exchanges, International Exchanges (1 point each) | 5 | 5 | 2 | 2 |
| Broker Connectivity & Ecosystem Test Winners | MetaTrader 5.00 |
TrendSpider 4.43 |
TrendSpider maintains a broker integrations directory and positions the platform as broker-agnostic while supporting direct integrations where available. TrendSpider’s broker directory is real (33 listed), but it does not publish the maximum tested broker API order latency. Practically, it’s “strong connectivity, limited published latency guarantees,” which is typical outside of broker-native platforms.
Key inputs:
- Live Trading: 5.00
- Broker Count (directory): 33 → 3.30 points
- Asset & Data Coverage: 5.00 (stocks/options/FX/US/international coverage points)
- Order latency disclosure: not published (per your notes)
Context: Traders who want analysis tightly connected to execution options benefit. If you require published, tested broker API order-latency specs.
Portfolio Tool Performance
TrendSpider scores C 2.10, below the 2.80 median, because its portfolio analytics coverage is limited relative to portfolio-first platforms.
TrendSpider’s strengths are scanning, chart automation, and strategy workflows—not portfolio health analytics. If portfolio management is a primary need (correlation, risk ratios, Monte Carlo simulations, rebalancing), specialized portfolio platforms dominate.
| Metric | Calculation | TrendSpider | High | Median | Low | Category Winner |
|---|---|---|---|---|---|---|
| Portfolio Health & Risk Analytics | Composite rating | 2.10 | 4.80 | 2.80 | 2.00 | Stock Rover, Portfolio123 |
| Health Check & Reporting Depth | % of critical financial metrics covered | 22/80 (27.5%) | 76/80 (95.0%) | 36/80 (45.0%) | 20/80 (25.0%) | Stock Rover |
This is consistent with TrendSpider’s design center: it’s a trading workflow tool, not a portfolio diagnostics suite.
Context: If you manage multi-asset portfolios and need risk decomposition, correlation matrices, allocation drift, and Monte Carlo-style planning, pair TrendSpider with a dedicated portfolio analytics platform.
Financial News Speed & Depth
TrendSpider scores AA 4.50, well above the 2.30 median, reflecting strong integration and usability of news in the trading workflow.
TrendSpider benefits from high-speed integrations (notably Benzinga linkage and automation-driven workflows), which is why it scores near the ceiling. It still trails true “wire-speed” terminal-style delivery, where sub-second latency is the defining feature.
| Metric | Calculation | TrendSpider | High | Median | Low |
|---|---|---|---|---|---|
| Financial News Speed & Quality Rating | Weighted rubric (news scanning, plots, watchlist, filtering, providers, alerts, real-time) | 4.50 | 5.00 | 2.30 | 0.00 |
| News Delay vs Primary Wires | Seconds of delay vs Bloomberg/Reuters (range) | 15–45 s | < 1 s | 60–300 s | Hours/Days |
| Financial News Speed & Depth Test Winners | MetaStock 5.00 |
Benzinga Pro 5.00 |
Scanz 5.00 |
Lab context includes:
- Measured delay: ~15–45 seconds vs primary wires (as provided)
- Feature scoring that rewards: chart-embedded news, watchlist news, filtering, multiple providers, alerts, and near-real-time delivery
In practice, this matters because fast, filterable news reduces reaction time and avoids context switching between terminals and charts.
Context: Active traders who trade catalysts benefit. If you invest only in the long term and review the news only periodically, you may not fully realize this advantage.
Community Utility Index (CUI)
TrendSpider’s B 3.75 score is modestly above the 3.25 median—solid, but not “global community powerhouse” territory.
TrendSpider’s community is “a growing, tech-focused hub” centered on automation templates and workflow sharing—valuable, but smaller than the “global default” communities. Where it performs well is contribution quality: users tend to share actionable automation logic rather than low-signal chatter.
| Metric | Calculation | TrendSpider | High | Median | Low |
|---|---|---|---|---|---|
| Community Utility Index | Avg of Active Community Size & Quality of Contribution scores | 3.75 | 5.00 | 3.25 | 1.80 |
| Active Community Size | Active users / community density rating | 3.50 | 5.00 | 3.00 | 2.00 |
| Quality of Community Contribution | Quality of shared IP/code/research rating | 4.00 | 5.00 | 3.50 | 1.50 |
| Community Utility Index Test Winners | MetaTrader 5.00 |
Trade Ideas 4.75 |
Sub-metrics indicate:
- Active Community Size: 3.50
- Quality of Contribution: 4.00
This reads as a focused, higher-signal community where sharing tends to revolve around automation logic, alerts, and workflows rather than mass-market social posting.
Context: Good for traders who want practical setup knowledge and templates. If you want a massive public script marketplace and a constant flow of ideas, the very largest platforms still dominate.
Support Infrastructure & SLA Audit
TrendSpider scores AA 4.50, above the 3.75 median, and this is one of the most practically meaningful “risk reducers” in the entire lab when you rely on alerts/automation.
| Metric | Calculation | TrendSpider | High | Median | Low |
|---|---|---|---|---|---|
| Support SLA Audit: Time-to-Human Benchmarks | Avg of Support Communication Channels & Support Response Times scores | 5.00 | 5.00 | 3.75 | 1.00 |
| Support Communication Channels | Access scale | 5.00 | 5.00 | 3.50 | 1.00 |
| Support Response Times | SLA scale | 5.00 | 5.00 | 4.00 | 1.00 |
| Stated SLA & Tested Outcomes | Practical benchmark | < 5 Minutes |
| Support Infrastructure & SLA Audit Winners | TrendSpider 5.00 |
TC2000 5.00 |
ThinkorSwim 4.75 |
TrendSpider’s support posture is unusually strong for a SaaS trading tool because it is treated like an operational promise, not “best effort.” With your update, it becomes a top-tier support leader (especially for time-to-human), even though TOS still sets the pace on the most aggressive sub-minute benchmark line item.
Key drivers:
- Support Channels: 4.50 (multi-channel posture)
- Support Response Times: 4.50 (fast response expectations)
- Stated SLA & tested outcomes: < 5 minutes (as provided)
- Public SLA (“Trader’s Bill of Rights”) and incident/status posture
Context: Traders running automation, scanning, and alerts benefit disproportionately from strong support + SLA posture. If you trade casually, support is still valuable but less central to outcomes.
