The Stochastic Oscillator momentum indicator compares an asset’s closing price to a range of its previous prices. It oscillates between 0 and 100; below 20 indicates oversold, and above 80 suggests an overbought market.
My backtested Stochastic Oscillator research on 1, 5, and 60-minute and daily charts across the DJ30 stocks over 12 years, equaling over 399 years of testing data, reveals the best strategy to adopt. On standard charts, the Stochastic Oscillator is not profitable in all timeframes. However, I did discover the most profitable Stochastic Oscillator settings for trading.
Using TrendSpider’s strategy backtesting engine, we can scientifically test the accuracy and success rate of the Stochastic Oscillator and its optimal settings.
Have you ever wondered if the Stochastic Oscillator could help you become a profitable trader? Well, you’re in luck! This deep dive will explore whether this indicator is worth your time and how to use it.
What is the Stochastic Oscillator?
The Stochastic Oscillator is a popular technical indicator developed by George Lane in the 1950s. In mathematics, stochastics is the study of random systems. It focuses on probability and statistics to describe unpredictable phenomena. Stochastic processes in financial markets can be used to understand how asset prices move. This indicator measures momentum to identify potential overbought or oversold market levels.
How does it work?
The Stochastic Oscillator measures momentum based on price action over a specified period. It is calculated from the security’s closing price and compares it with its price range over a user-defined number of periods.
The Oscillator ranges between 0 and 100. Values above 80 indicate an overbought market, meaning that prices may soon come down; thus, it is a possible sell signal. Prices below 20 are considered oversold, meaning a possible buy signal. The Oscillator can also form crossovers, which can be used as another indication of potential buying or selling signals.
Key Takeaways
- The Stochastic Oscillator is designed to predict randomness in markets.
- Created in the 1950s, this indicator performs poorly in modern financial markets.
- On an hourly timeframe, stochastics can produce 43% of winning trades.
- The Stochastic Oscillator is used to determine when to buy and sell stocks.
5 Ways to Trade the Stochastic Oscillator
There are five strategies for trading the stochastic Oscillator: crossovers, momentum, trend-following, momentum reversal, and a breakout strategy.
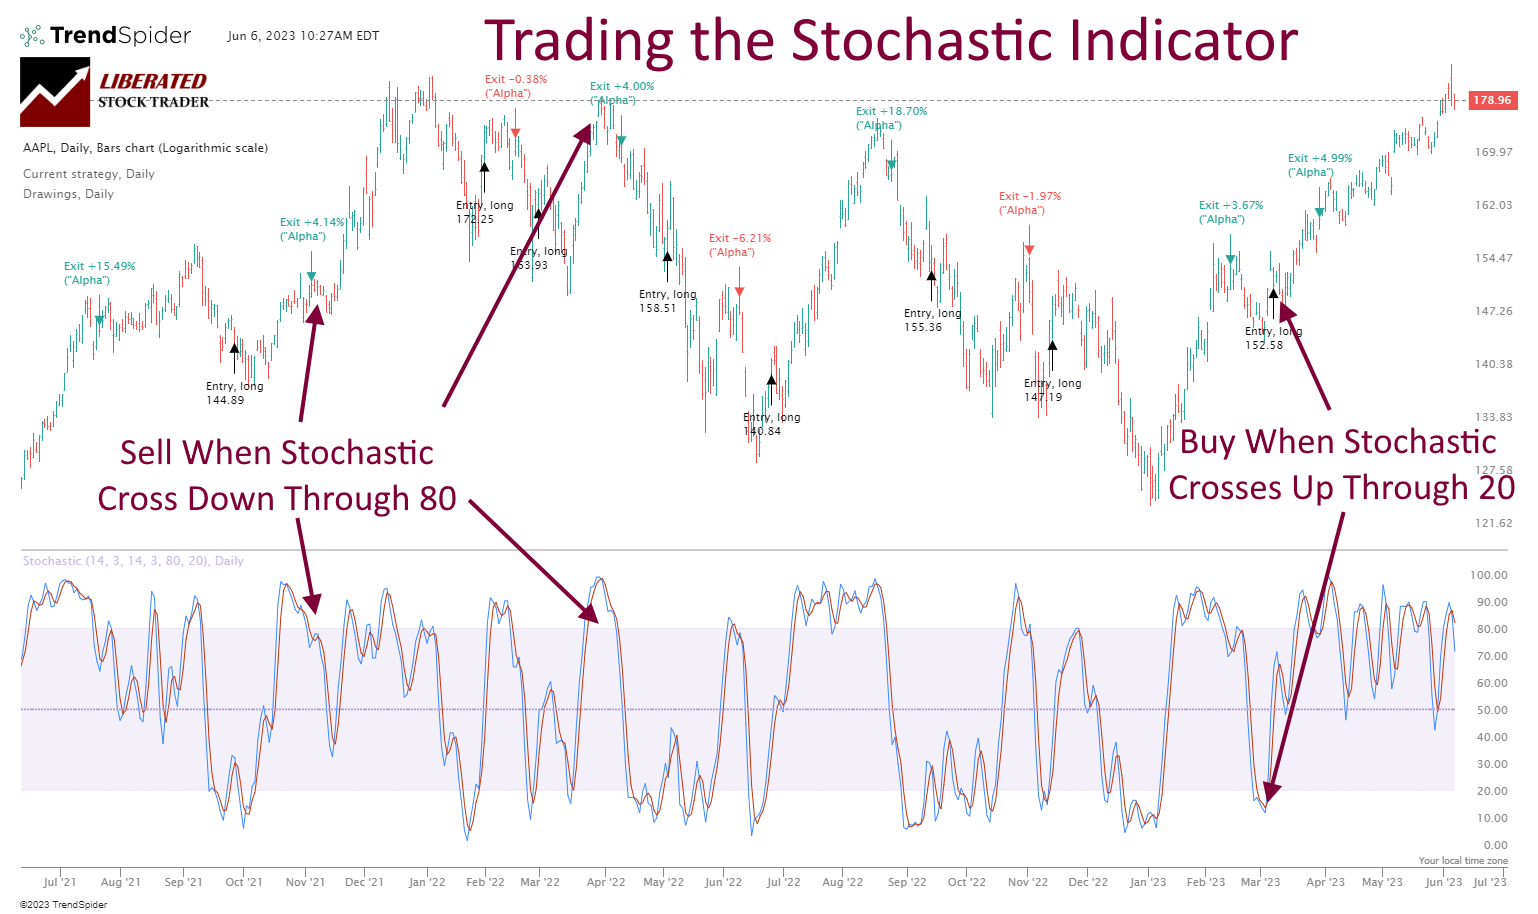
Chart Produced with TrendSpider
1. Crossover Strategy
This strategy involves looking for a crossover between two lines (K line and D line). When the K line crosses above the D line, this is a signal to go long; when the K line crosses below the D line, this is a signal to go short.
2. Momentum Strategy
This strategy involves looking for momentum in the Stochastic Oscillator. When the lines diverge (move away from each other) and increase in intensity (K line moving further away from the D line), this is a signal to go long; when the lines converge (move towards each other) and decrease in intensity (K line moving closer to the D line), this is a signal to go short.
3. Trend-Following Strategy
This strategy involves looking for trends in the Stochastic Oscillator. When the K line is above the D line, and both are moving higher, this is a sign of an uptrend; when the K line is below the D line, and both are moving lower, this is a sign of a downtrend. Going long on an uptrend and short on a downtrend can be profitable strategies if the trade entry occurs at the right time. The trader must be mindful of the potential reversal points and act accordingly.
4. Momentum Reversal Strategy
This strategy involves spotting divergences between the Stochastic Oscillator and price action. When the K line is making a higher high while the price is making a lower high, this could indicate that the uptrend is losing momentum and may be reversing. On the other hand, when the K line is making a lower low while the price is making a higher low, this could indicate that the downtrend is losing momentum and may be reversing. Taking advantage of these reversals by entering long/short trades can be profitable. Traders should also look for other indicators, such as the Relative Strength Index (RSI), Moving Average Convergence Divergence (MACD), or Bollinger Bands, to confirm or strengthen the potential signal given by the Stochastic Oscillator.
5. Breakout Strategy
This strategy involves entering a trade when security breaks out of its trading range. Traders can look for levels of support and resistance to identify a breakout. If the price is breaking higher than the previous high, it could indicate that buyers are in control and traders can enter long trades. On the other hand, if the price breaks lower than the previous low, it could indicate that sellers are in control and traders can enter short trades.
Traders should consider the risks associated with trading breakouts. As prices move sharply in either direction after breaking out, there is an increased risk of entering a false breakout. To manage this risk, traders should always use a stop loss to limit their losses if the trade does not move in the expected direction. Additionally, waiting for an indication that the breakout is valid is important before taking action. This may include waiting for a sustained break above or below support/resistance levels.
Calculation
The stochastic Oscillator utilizes two lines, the %K line and the %D line, which are based on a security’s closing price. The %K line is calculated by subtracting the low of the look-back period from the current closing price and then dividing that difference by the highest and lowest prices within that period.
The result of this calculation is multiplied by 100 to give it a range between 0 and 100. The %D line is simply an average of %K over a specified number of periods. Using both lines, traders can gauge whether prices increase or decrease over time.
The stochastic Oscillator is automatically calculated using the best charting software like TrendSpider or TradingView. But if you want to understand the formula, read on.
The Stochastic Oscillator Formula
The Stochastic Oscillator is calculated using the formula:
>%K = [(Today's Close - Lowest Low in N Periods)/(Highest High in N Periods - Lowest Low in N Periods)] * 100.
Where:
- %K is the Stochastic Oscillator Value
- Today’s Close is the most recent closing price
- Lowest Low in N Periods is the lowest low of the previous N periods
- Highest High in N Periods is the highest high of the previous N periods.
- N represents the number of periods over which to calculate the Stochastic Oscillator.
Generally, 14 is used for N and can be adjusted depending on the analyzed stock.
The formula’s result is a number between 0 and 100, which indicates the direction of price action in relation to its range over a given period. Generally, readings below 20 indicate an oversold condition.
The most common setting for the Stochastic Oscillator is 14 periods, which can be applied to any time frame. This calculation will produce a value that oscillates between 0 and 100, with readings below 20 indicating oversold conditions and above 80 indicating overbought conditions.
The Stochastic Oscillator can also be used to identify potential divergence signals. When the price of an asset is making higher highs while the Stochastic Oscillator is making lower highs, a bearish divergence may be present. Similarly, when the price of an asset is making lower lows while the Stochastic Oscillator is making higher lows, a bullish divergence may be present.
These divergences can be used to predict potential reversals in the price of an asset and present trading opportunities. However, traders should be aware that divergences can also fail to predict accurate reversals and should use other technical analysis tools to confirm divergence signals before entering any trades.
Pros & Cons
The main advantage of using Stochastic Oscillators is that they can help traders identify potential overbought or oversold conditions in the market and divergences that may signal possible reversals in an asset’s price. This information can inform trading decisions, such as when to enter and exit positions. Additionally, Stochastic Oscillators can help provide insight into a market’s momentum to gauge better when trend changes may be near.
One potential downside of using Stochastic Oscillators is that they are considered lagging indicators, meaning they often take longer to identify possible turning points than other indicators. This can be problematic for traders looking to get in and out of positions quickly, as they may not have sufficient time to make trades based on Stochastic Oscillator signals. Furthermore, Stochastic Oscillators only provide insight into price movements over a certain period, so they may not capture longer-term trends. Finally, Stochastic Oscillators can be prone to false signals, which may lead traders to enter positions that ultimately fail or miss out on trades with greater potential returns.
How I Set Up Stochastic Oscillator Backtesting
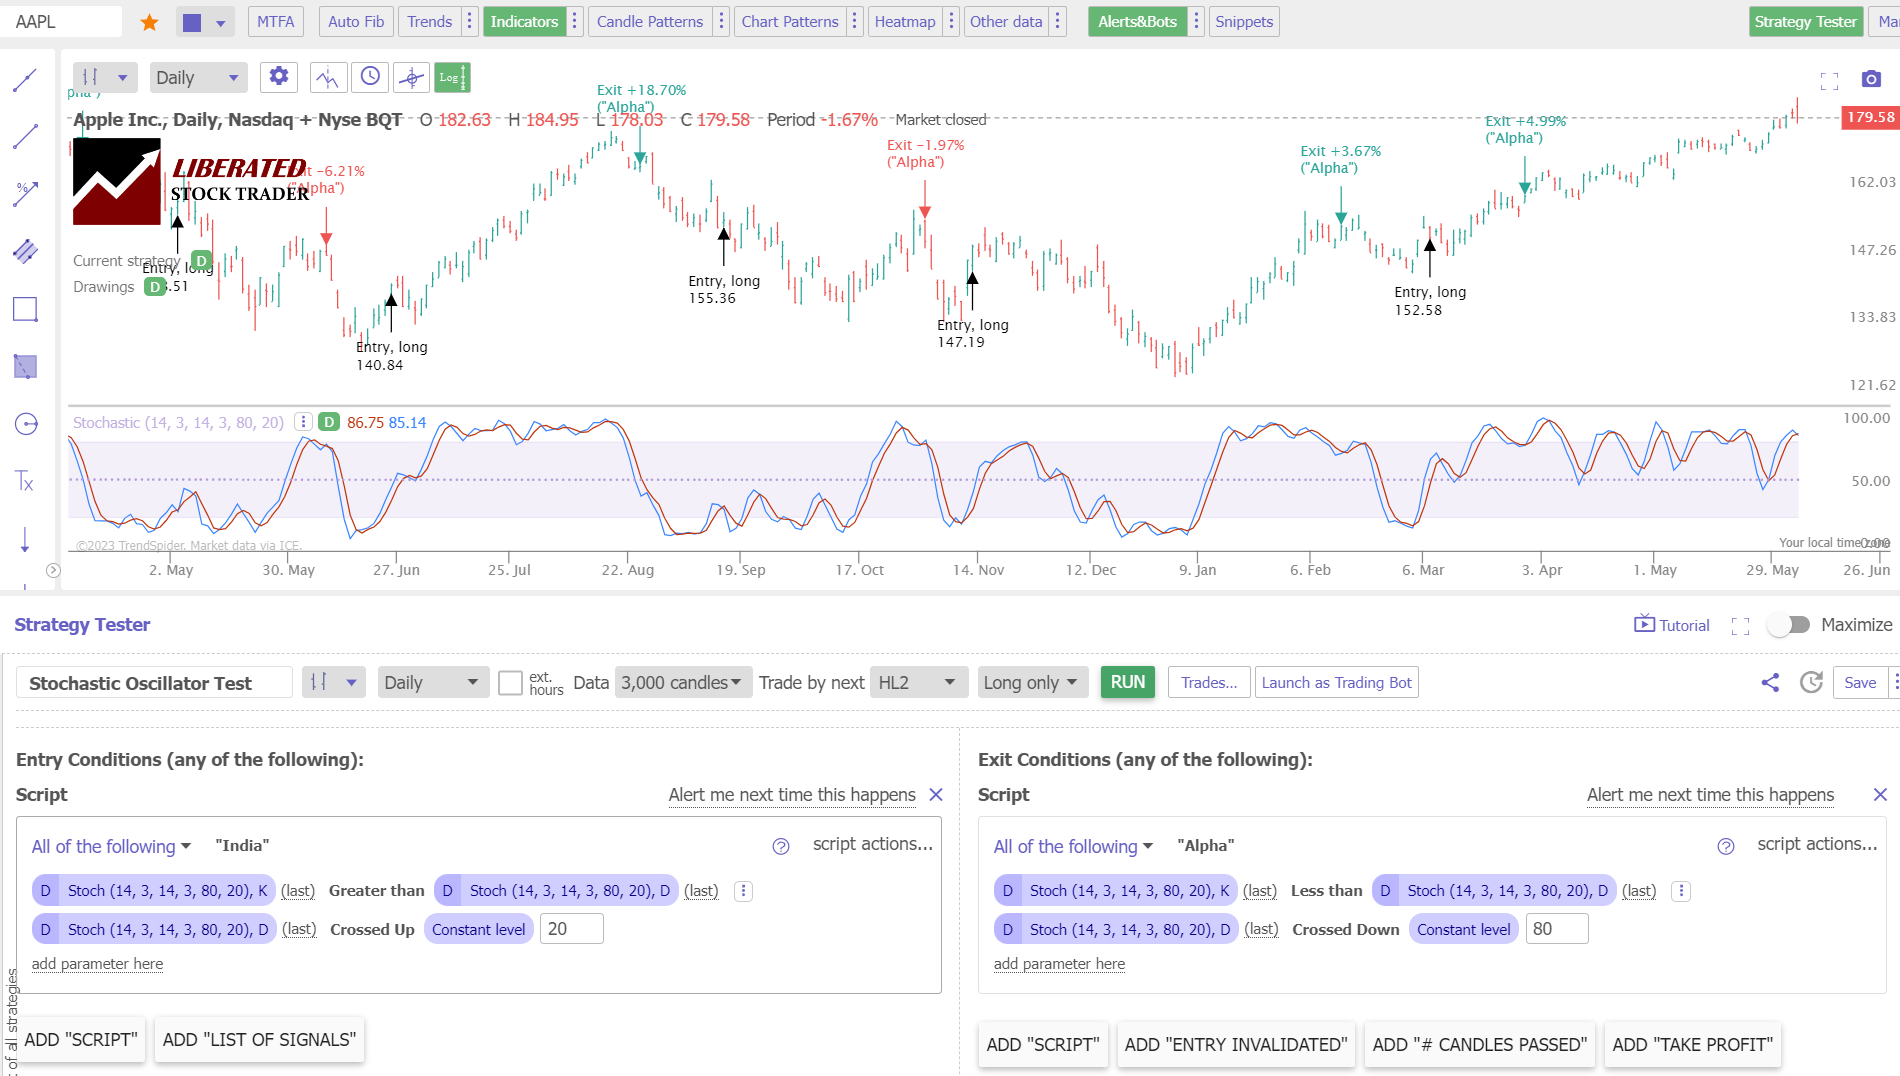
Follow these steps to set up Stochastic Oscillator backtesting in TrendSpider: Register for TrendSpider, select Strategy Tester > Entry Condition > Add Script > Add Parameter > Condition > Indicator > Stochastic K Greater Than Stochastic D + Stochastic D Crossed Up Through 20.
For the Sell Criteria, select > Add Script > Add Parameter > Condition > Indicator > Stochastic K Less Than Stochastic D + Stochastic D Crossed Down Through 80. Finally, click “RUN.”
Backtest Your Strategies on TrendSpider Now
Using the award-winning TrendSpider software, we can easily test any indicator, chart pattern, or chart performance on any US stock. Our Trendspider review reveals it offers the most powerful trading strategy development and testing service.
Testing Methodology
Using the standard setting of 14, we tested 4 OHLC/Candlestick chart settings, 1, 5, 60 minutes, and daily charts.
| Stochastic Indicator Setting | OHLC Chart | Duration |
| 14, 3, 14, 3 | 1-min | 20 Days |
| 14, 3, 14, 3 | 5-min | 3 Months |
| 14, 3, 14, 3 | 1-hour | 2 Years |
| 14, 3, 14, 3 | Daily | 12 Years |
| Entry Criteria: | %K > Than Stochastic %D | %D Cross Up Through 20 |
| Exit Criteria: | %K Less Than Stochastic %D | %D Cross Down Through 80 |
| Sell: | Next Open |
My thorough testing awarded TradingView a stellar 4.8 stars!
With powerful stock chart analysis, pattern recognition, screening, backtesting, and a 20+ million user community, it’s a game-changer for traders.

Whether you're trading in the US or internationally, TradingView is my top pick for its unmatched features and ease of use.
Explore TradingView – Your Gateway to Smarter Trading!
Stochastic Oscillator Test Results
After testing the Stochastic Oscillator on 399 years of data, the results suggest it should not be used as a standalone indicator. The only relatively successful setting was on a one-hour chart over the last two years, with a success rate of 43%.
| Stochastic Indicator Setting | OHLC Chart | Duration | % Winners | Avg # Trades |
| 14, 3, 14, 3 | 1-min | 20 Days | 27% | 88 |
| 14, 3, 14, 3 | 5-min | 3 Months | 20% | 73 |
| 14, 3, 14, 3 | 1-hour | 2 Years | 43% | 75 |
| 14, 3, 14, 3 | Daily | 12 Years | 20% | 40 |
| Average | 28% | 79 |
On a candlestick/OHLC chart, the stochastic Oscillator performed poorly on 1- and 5-minute and daily charts. The average percentage of stocks beating a buy-and-hold strategy with a stochastic oscillator was only 28%, meaning 72% of long-term investors would have outperformed traders using this indicator.
Example: A Failed 12-Year Daily Stochastic Test
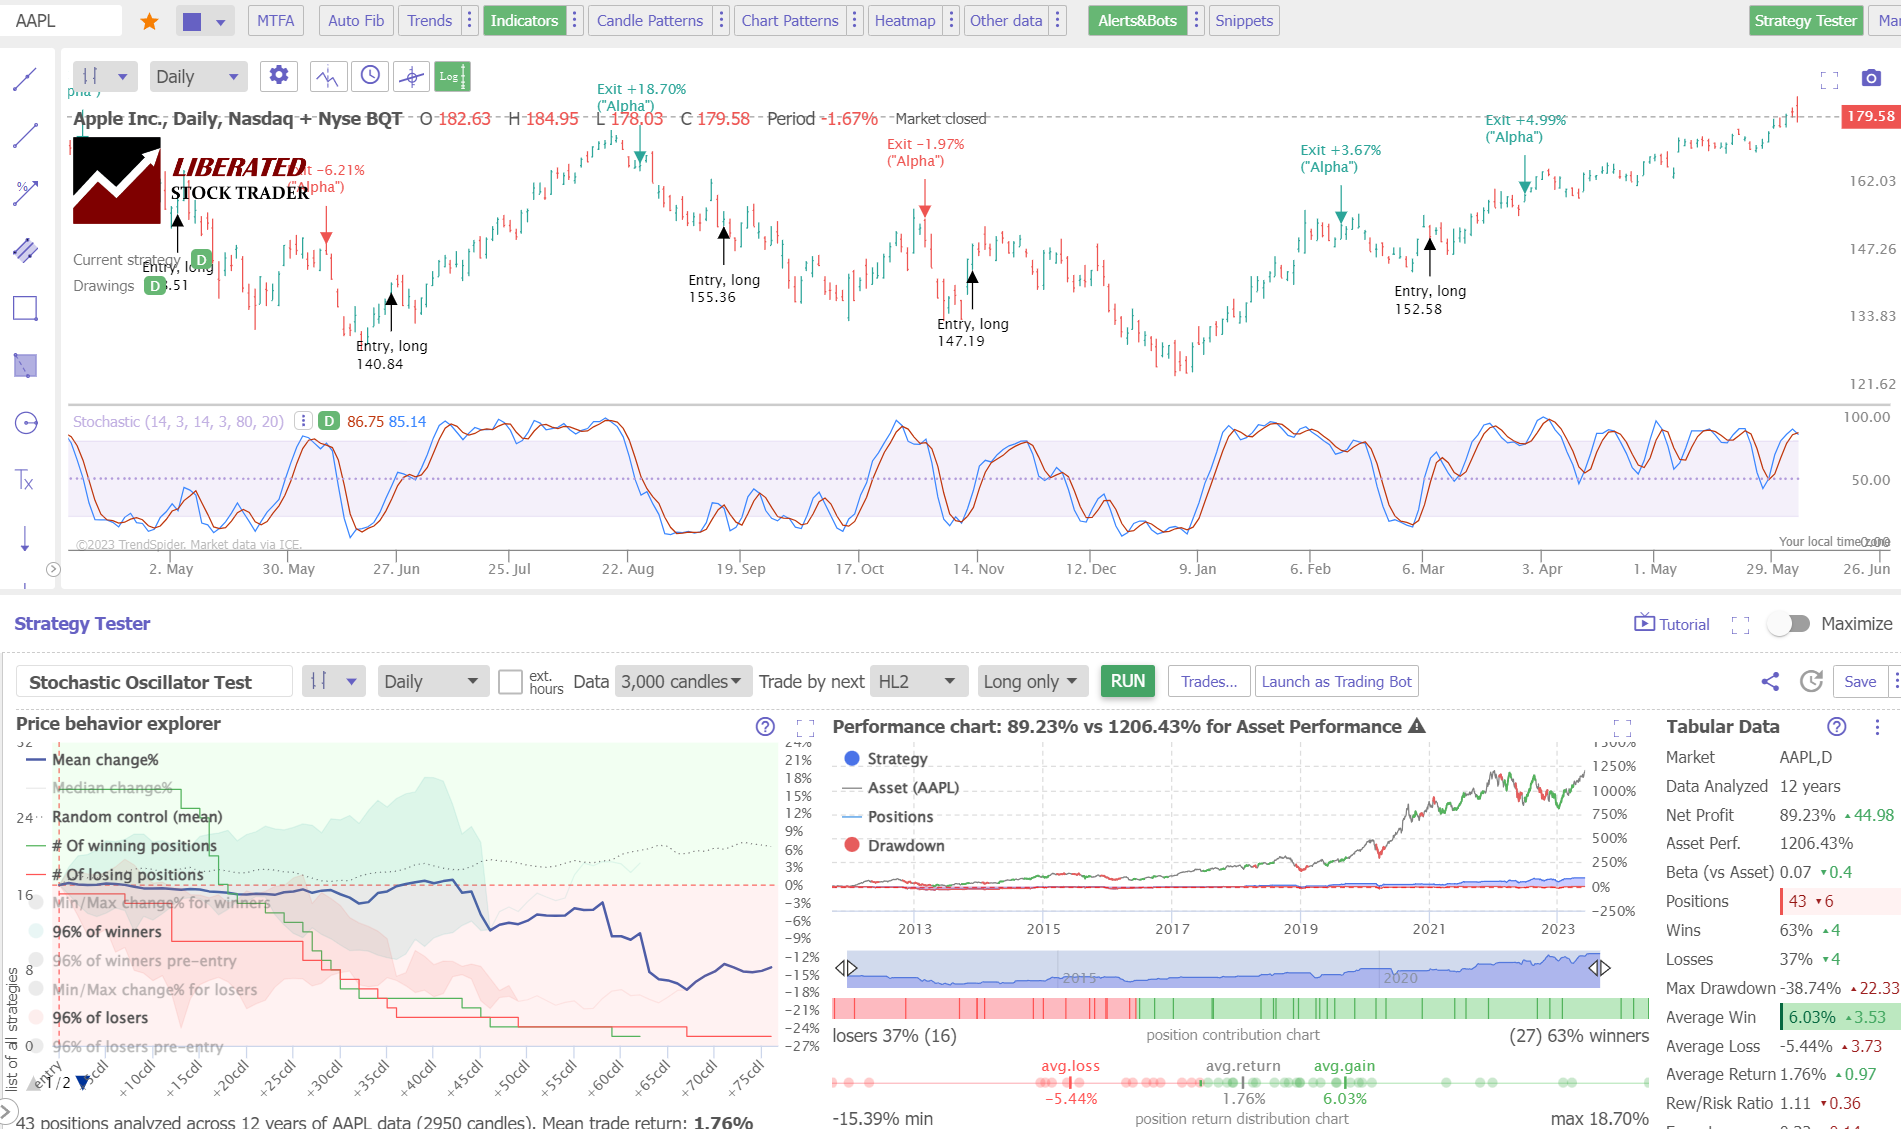
This is a typical test of stochastics on a daily chart. Applpe Inc. (Ticker: AAPL) over 12 years shows a standard Stochastic Oscillator strategy on a daily OHLC chart, returning a profit of +89% versus the buy-and-hold return of 1206%. There were 43 trades with a 63% win rate, yet stochastics failed to perform with a sizable loss.
Backtest Powerful Strategies on TrendSpider Now
Example: A Successful 2-Year Hourly Stochastic Test
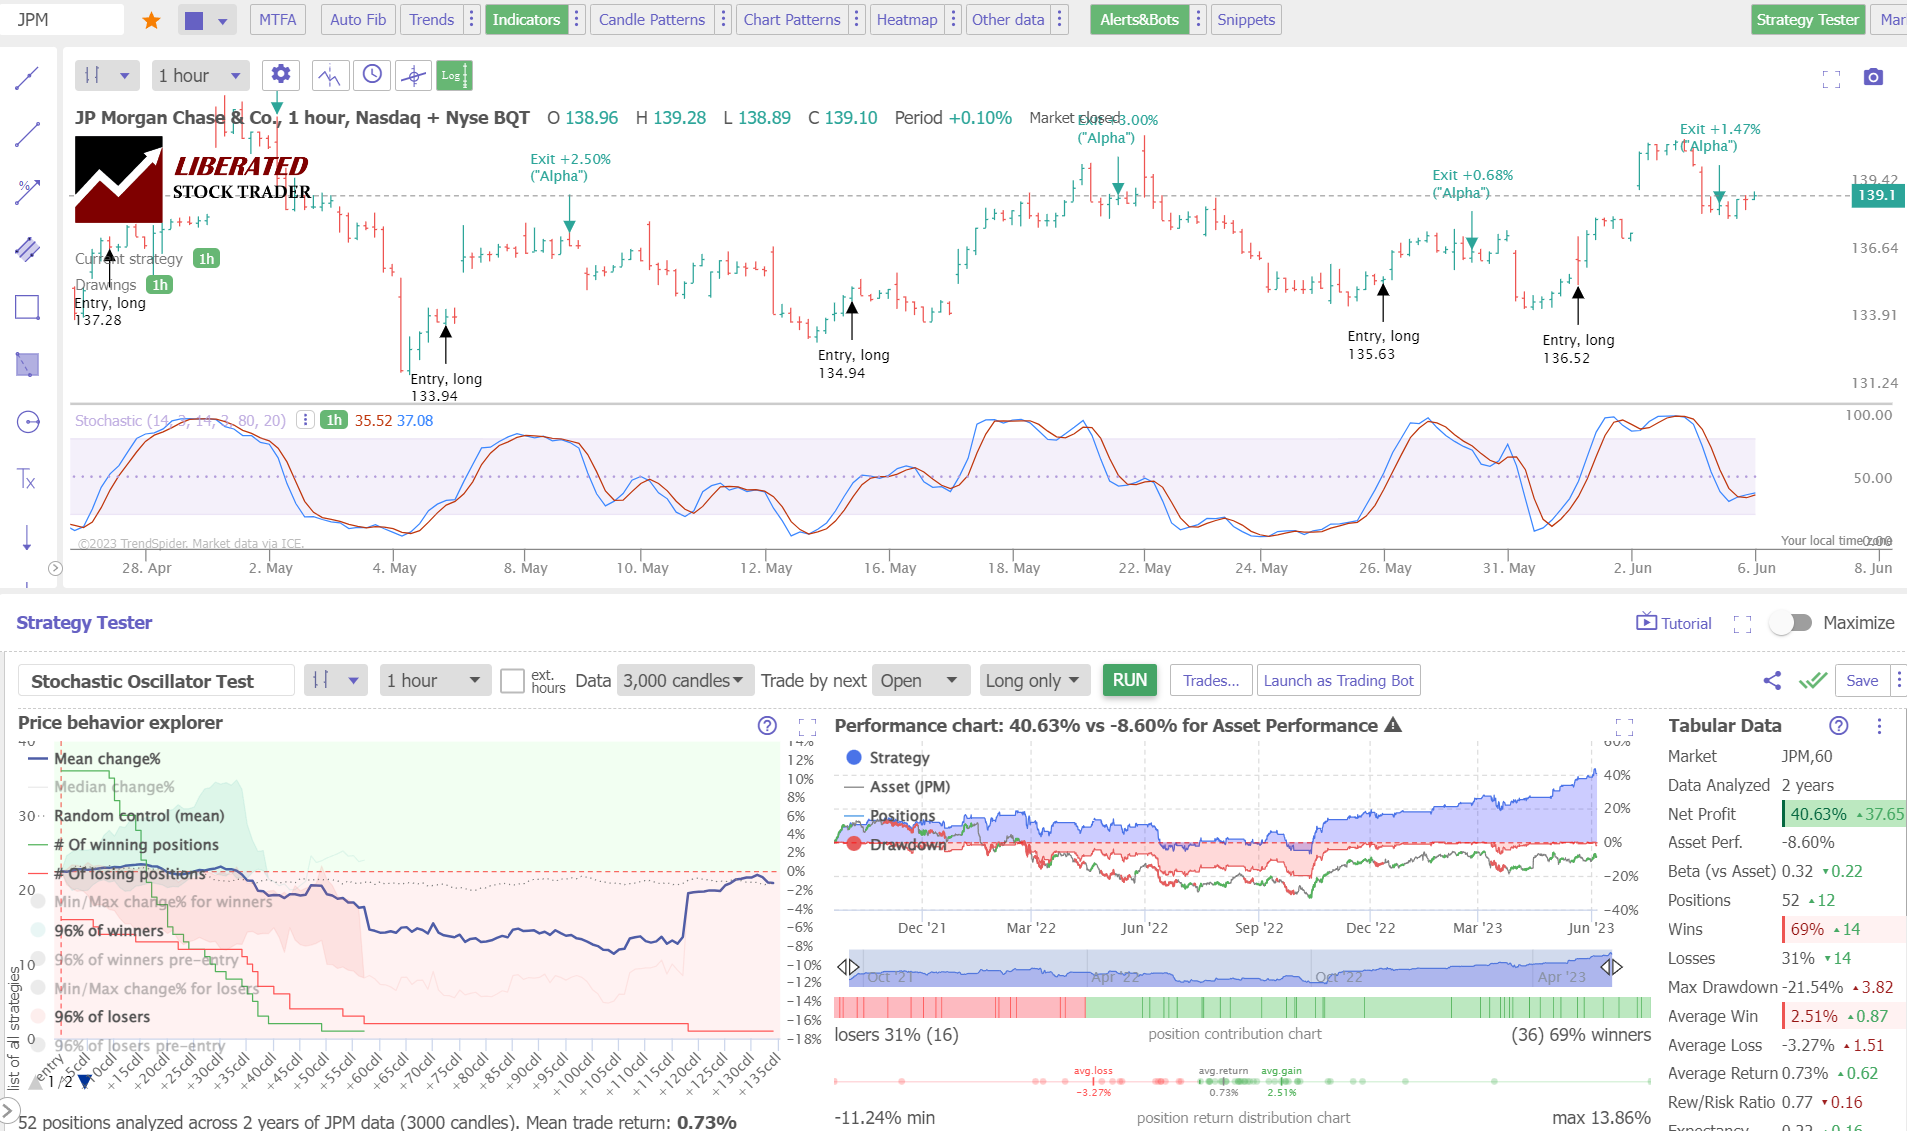
Our testing of JP Morgan Chase & Co. over 12 years shows a Stochastic Oscillator strategy returned a profit of +40% versus the buy and hold return of -8.6%. This is a vastly superior return versus the market, and this difference is down to stochastics working well on hourly charts. There were 52 trades, with average winning trades at 69%.
Get Point & Click Backtesting on TrendSpider
Combining Stochastics with Other Indicators
This indicator can be combined with other technical indicators to form a complete trading strategy. For example, MACD, moving averages, Heikin Ashi charts, price rate of change, Aroon, or even bullish chart patterns can be used.
To test whether combining stochastic oscillators with other indicators is profitable, I suggest using TrendSpider, our recommended stock research and AI power trading software.
Stochastic Oscillator Test Summary
After testing the Stochastic Oscillator on the Dow Jones 30 stocks over 12 years on four timeframes, the results suggest it is a weak indicator on candlestick and OHLC charts. The average percentage of stocks beating a buy-and-hold strategy with a stochastic oscillator was only 28%, meaning 72% of long-term investors would have outperformed this indicator.
Best Stochastic Oscillator Settings
Our 399 years of backtests revealed conclusively that the best settings for Stochastic Oscillator are using the standard 14,3,14,3 on an hourly OHLC/candlestick chart, which produced a 43% win rate. Avoid using the stochastics on 1, 5-minute, and daily charts, as you have an 80% chance of losing money.
Is the Stochastic Oscillator Good
No, based on our decades of researched data, the Stochastic Oscillator is a poor indicator for buy and sell signals and trading on all timeframes. The Stochastic Oscillator averages only a 28% success rate versus a buy-and-hold strategy.
Is the Stochastic Oscillator Reliable
No, the Stochastic Oscillator is unreliable as it produces inconsistent results over time and across different asset types. Our tests found that 72% of the time, any strategy built on stochastics would have underperformed a buy-and-hold strategy. Therefore, using this indicator for investment decision-making isn’t recommended.
Should Stochastics be used to buy and sell?
Over 399 years of data across 30 Dow Jones stocks, myresearch shows that the standard Stochastic Oscillator setting 14 should be avoided for trading buy and sell signals. The only usable configuration is 14 on a 1-hour per bar chart.
Limitations
The biggest limitation of a Stochastic Oscillator is it produces 72% of losing trades on a standard OHLC chart. Like most indicators, it does not perform well in consolidating markets. Using the smoothing effects of a Heikin Ashi chart changes the results from a 19% win rate to a 63% win rate.
Summary
In conclusion, using the Stochastic Oscillator to generate buy and sell signals for day trading is unreliable. Investors should avoid relying on this indicator and use proven methods such as bullish chart patterns or Heikin Ashi charts for trading or modern portfolio strategies.
FAQ
Is the Stochastic Oscillator good for trading?
No, our research shows that Stochastics is a poor indicator on all timeframes from 1 minute to daily charts. Stochastics produced a weak 28% average success rate versus a long-term buy-and-hold strategy. Our 12-year tests of the 30 Dow Jones Industrial Average stocks prove Stochastics should be avoided.
What is the best setting for Stochastics?
Our testing shows that the best setting for Stochastics is 14 on an OHLC 1-hour chart which yields a 43% win rate. Stochastics-14, on all other timeframes, underperformed the average stock market returns.
What indicators are better than Stochastics?
Stochastics is an unprofitable indicator, but others have higher success rates, such as Heikin Ashi charts, combined with the rate of change, RSI, and bullish chart patterns. Our testing has proven these indicators to be more effective, work on many timeframes, and are more successful in trading strategies.
Is Stochastics the best indicator?
No, Stochastics is a very poor indicator for trading, with a 72 percent failure rate; bullish chart patterns such as the Double Bottom have an 88 percent success rate. I recommend learning to backtest and fine-tune trading strategies with TrendSpider for trading success.
What is the best timeframe for Stochastics?
The best timeframe for Stochastics is a 14 setting on an hourly chart, which produced a 43 percent win rate, according to TrendSpider. We conducted a 399-year backtest and found Stochastics-14 on a daily chart produces only 20% of winning trades.
How reliable is Stochastics?
Stochastics is an unreliable technical analysis chart indicator. Our 399 years of backtested data on 30 major US stocks show a 28% chance of beating a buy-and-hold strategy across all chart timeframes.
What is the best software for trading and testing Stochastics?
When conducting our in-depth Stochastics trading analysis, we relied on TrendSpider - an industry-leading trading tool for backtesting and strategy development. I was impressed by its power and simplicity!
Which is better, Stochastics or Moving Averages?
Stochastics' low average success rate of 28% is still better than the moving average performance of 10% on standard OHLC charts based on 5,640 years of backtested exchange data. Our research indicates that an exponential moving average of 20 on a Heikin Ashi chart outperforms Stochastics with an 83% success rate.
How to read the Stochastics chart?
To read Stochastics, look for oversold and overbought levels with the %K at 20 and 80, respectively. When the K-line crosses down through 80, it is a sell signal to traders; when it crosses up through 20, it is a buy signal.
What is the best software for trading Stochastics indicators?
TrendSpider is hands-down the top software for trading and backtesting Stochastics indicators; with point-and-click backtesting requiring no coding, it's a game-changer! TradingView is also good, offing pine code backtesting and global stock exchange, crypto, and forex coverage.
Is Stochastics the same as a moving average?
No, Stochastics is not the same as a moving average. There are four main moving averages; simple, exponential, weighted, and Hull. Stochastics is an oscillating indicator with a different calculation and higher reliability.
Does Stochastics work?
Yes, Stochastics works reasonably well, but only with a specific configuration using Stochastics-14 on an hourly chart. This setup is tested to have a 43% success rate and outperforms the DJ30 stocks. All other standard settings on OHLC/ candlestick charts are not profitable.
How accurate is Stochastics?
The Stochastics indicator is inaccurate, especially with a standard OHLC, line, or candlestick chart. Our research indicates that Stochastics has a 28 percent win rate. Only the rate of change indicator on a Heikin Ashi chart is more effective at 66 percent.
How to make money trading Stochastics?
Making money using the Stochastic Oscillator is difficult. However, it is possible. The best way to succeed with Stochastics is by using a specific setup tested for higher reliability. This involves using the Stochastic-14 on an hourly chart and implementing a strategy based on the buy/sell zones generated from this indicator.
Is Stochastics effective for day trading?
No, Stochastics is not effective for day trading. Our test results on 1-minute charts show a low success rate of 27 percent, and a 5-minute chart had a 20 percent success rate.