Finding High-Yield Dividend Stocks: 3 Tested Strategies
To find high-yield dividend stocks requires scanning for key criteria such as dividend yield, growth, payout ratio, and EPS. A safer and more profitable strategy will incorporate value investing criteria like margin of safety and price to sales.
Dupont Analysis Explained: Company Financial Performance Models
By breaking down ROE into profitability, efficiency, and leverage factors, DuPont Analysis allows investors and analysts to pinpoint the strengths and weaknesses of a firm's financial health.
Efficient Market Hypothesis vs. Random Walk Explained
The difference between the Efficient Market Hypothesis and Random Walk is that the former suggests that all available information is already incorporated into a stock's price, whereas the latter states that current prices are completely independent of past performance.
7 Strategies to Find the Best Value Dividend Stocks
Our research combines criteria for selecting value stocks and dividend-paying stocks to create seven strategies for finding under-valued dividend stocks. We include the exact criteria to use and a step-by-step guide to implementing them into a stock screener.
Is The Stock Market Overvalued? The Data Says Yes!
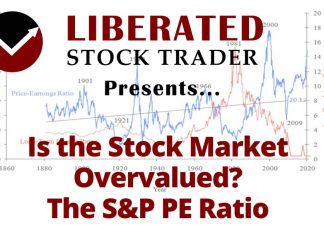
According to the Shiller PE Ratio, the US stock market is currently 19.2% overvalued compared to its 200-month moving average. Currently, the PE ratio of the S&P 500 is 31, and the 10-year average is 26.
Return on Common Stockholders Equity Insights for Investors
Return on Common Stockholder's Equity (ROCE) is a financial ratio measuring the profitability relative to the common equity shareholders have invested in a company.
The Best CANSLIM Stock Screener & How To Find CANSLIM Stocks
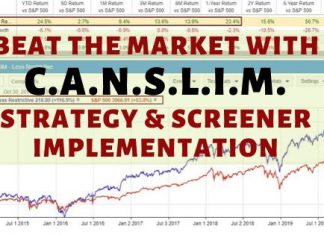
The best CANSLIM stock screeners to accurately find growth stocks are Stock Rover for US investors and TradingView for international traders. Stock Rover has 3 pre-built CANSLIM screeners, and one is available for free.
Investment Turnover: Understanding Asset Management Efficiency
Investment turnover is a financial metric for investors and analysts seeking to understand how effectively a company uses its capital to generate revenue.
Creating the Best Buffett Stock Screener for Value Portfolios
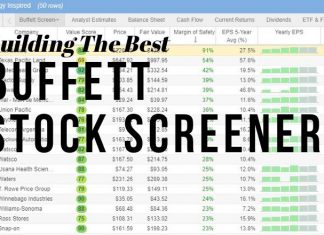
The best Buffett and Graham stock screener is Stock Rover, which provides eight fair value, intrinsic value, and forward cash flow calculations to help you build a great portfolio.
Understanding the Net Profit Ratio for Better Investing
The Net Profit Ratio is a key financial ratio for better investing, telling us how efficiently a company generates profit compared to its revenue and competitors.
4 Best Value Investing Stock Screeners of 2024
The best Benjamin Graham & Warren Buffett stock screeners for value investing are Stock Rover, Portfolio 123, TradingView, and TC2000.
Economic Value Added (EVA) Explained: Shareholder Value
Economic value added, or EVA is a sophisticated measure for assessing a company's financial performance and creating shareholder wealth by measuring the residual income after deducting the cost of capital.
What is Stock Float: How to Find, Calculate & Trade Float
Stock float is the number of shares available to trade in the public market. This includes all shares held by institutional and retail investors and restricted stock owned by insiders. Float can impact a stock's trading volume, price movements, and volatility.
Long-Term Debt Ratio: Understanding Financial Stability
The Long-term debt ratio is a financial metric investors use to assess a company's use of long-term debt for financing its operations. A high long-term debt ratio over 25% indicates a higher investing risk, whereas a low ratio indicates a company is in better financial shape.
Total Asset Turnover: Understanding Business Efficiency
Total asset turnover is a financial metric used to assess a company's efficiency in using its assets to generate sales. It is a vital ratio for investors and analysts seeking to understand how well a company utilizes its asset base to produce revenue.
8 Best Free Stock Market Heatmaps Tested 2024
Our research shows the best stock market heatmaps are TradingView, Finviz, Finscreener, and Stock Rover. TradingView is visually stunning and covers all stock, forex, and crypto exchanges.
Times Interest Earned Ratio: Explaining Solvency & Risk
The Times Interest Earned Ratio, or TIE, is a financial metric for gauging a company's ability to settle its interest obligations. By assessing the number of times a company could theoretically cover its interest payments with its current pretax earnings, it offers a clear view of financial health, particularly regarding solvency and risk.
What Does Over-Leveraged in Finance or Investing Mean?
Over-leverage is using excessive debt to finance investments or business operations, leading to excessive risk. Financial risk increases as the level of debt exceeds the ability to generate sufficient returns to cover the interest payments and principal repayment obligations.
Return on Average Equity (ROAE): Company Profitability Explained
The Return on Average Equity (ROAE) financial ratio measures a company's profitability by comparing its net earnings to average shareholders' equity.
Reverse Stock Splits Explained & How to Profit From Them
Reverse stock splits are typically undertaken by companies seeking to boost their stock price by reducing the number of outstanding shares. Often seen as a sign of weakness, it attracts short-sellers attempting to profit from statistically proven future price declines.
Our Best Training & Strategies
Liberated Stock Trader Pro: Learn Stock Market Investing
Learn stock market investing with the complete online stock trading course by Barry D. Moore, a certified financial analyst from the International Federation of Technical Analysts (IFTA).
ETF Investing Strategy: MOSES Improves Performance & Lowers Risk
The MOSES ETF investing strategy is a powerful suite of indicators meticulously backtested over 100 years. Designed to empower you to outperform the market, it equips you with the tools to navigate major stock market crashes and unlock greater investing performance.
Our LST Strategy Beat the Stock Market’s S&P 500 By 102%...
Decades of research and testing unveiled the Liberated Stock Trader Beat the Market System. Our 9-year, backtested, and proven strategy targets 35 financially healthy high-growth stocks, producing a track record of beating the S&P 500 by 102%.

