Operating Profit Margin: Formula & Tips for Investors
Operating Profit Margin, often represented as a ratio or percentage, reflects the proportion of revenue after accounting for the costs and expenses associated with a company's primary operations.
Finviz Stock Screener Review 2024: Free vs. Elite Tested
Our Finviz review testing reveals an effective free stock screener, fast market heatmaps, and stock chart pattern recognition. Finviz Elite includes real-time data, interactive charts, and backtesting for a competitive price.
How To Analyze Stocks with Fundamental & Technical Analysis
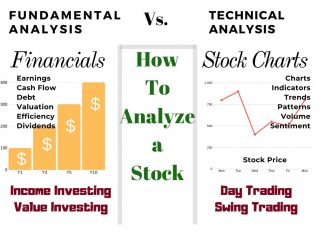
There are two ways to analyze stocks. Fundamental analysis, which evaluates criteria such as PE ratio, earnings, and cash flow. Technical analysis, which involves studying charts, stock prices, volume, and indicators.
Cash on Hand Explained: Cash is King for Businesses
Cash on Hand is a financial metric indicating the amount of liquid capital available to an individual or business. For businesses, it includes physical currency, funds in bank accounts, and liquid assets readily convertible to cash.
How to Calculate Intrinsic/Fair Value of Stocks + Excel Calculator
To calculate the intrinsic value of a stock, estimate a company's future cash flow, discount it by the compounded inflation rate, and divide the result by the number of shares outstanding. The result is a stock's fair value.
Debt-to-Capital Ratio: Understanding Financial Leverage
The debt-to-capital ratio measures a company's financial stability and leverage by comparing its total debt to its capital base, including debt and equity. It provides insight into what proportion of a company's operations is financed by debt versus shareholders' equity.
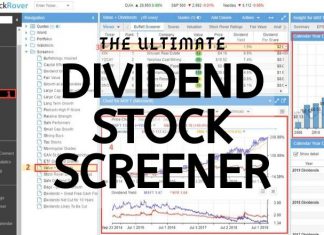
Creating the Best Dividend Stock Screener: 4 Strategies & Criteria
Our research shows you how to create the best dividend stock screener; you must decide on a high-yield, safe, or dividend growth strategy. Next, choose our tested criteria for your screener, like payout ratio, yield, and coverage.
How Financial Leverage Works! Using Debt to Amplify Returns
Financial leverage refers to using borrowed funds to increase the potential return on investment. It magnifies potential gains and losses, vital to a company's capital structure.
How to Read Financial Statements for New Investors
The three main types of financial statements are the balance sheet, income statement, and cash flow statement. Each one provides a different perspective on a company's finances.
Payout Ratio: Understanding Dividend Income Sustainability
The payout ratio, also known as the dividend payout ratio, is a critical financial metric that investors use to evaluate the sustainability of a company's dividend payments.
Stock Market Beginner’s Guide [2024 Elite Investor Edition]
Understanding stock market basics is a crucial first step for beginners. Understanding exchanges, indexes, buy-and-hold, and diversification is a good start. Risks, rewards, and goals are key to a solid foundation. Finally, charts, patterns, and indicators are the investor's toolbox.
10 Best Stock Screeners of 2024: Tested by LiberatedStockTrader
After comprehensive hands-on testing, we have identified the best stock screeners as TrendSpider (4.8/5 Stars), Stock Rover (4.7), TradingView (4.5), and Trade Ideas (4.4).
How to Calculate Stock Beta: Formula & Examples Explained
To calculate Beta or (β) you need to divide the variance of an equity's return by the covariance of a stock index's return.
Income Elasticity Explained: Consumer Behavior in Economics
Income elasticity of demand is an economic measure showing how demand responds to consumer income changes. This metric helps businesses and economists understand how economic changes affect the demand for goods.
Debt-to-EBITDA Ratio & Calculator: Assessing Financial Health
The Debt-to-EBITDA ratio assesses a company's ability to pay off its debt. It compares a company's total debt to earnings before interest, taxes, depreciation, and amortization (EBITDA).
39 Screening Criteria To Find Great Value Stocks
The most useful screening criteria for finding value stocks are intrinsic value, margin of safety, the PE ratio, and earnings power value. Used in combination, these metrics can find good undervalued companies.
Price Floors in Economics: Understanding Minimum Prices
A price floor is a government-imposed limit on how low a price can be charged for a product, service, or commodity. This is designed to ensure the price stays high enough to protect the interests of producers, often at a point above the natural market equilibrium where supply equals demand.
Leading Indicators: Super-Charging Your Investing Strategy
Leading indicators are predictive signals that forecast future economic activity and market trends, allowing investors to anticipate changes before they occur.
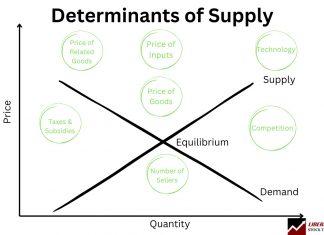
Determinants of Supply: Key Factors Explained with Examples
The determinants of supply are crucial in economics, forming the foundation of functioning markets and the economy. Key determinants of pricing, labor, taxes, competition, suppliers, and technology cause the supply of goods and services to change.
Find the Best Defensive Stocks: Ben Grahams Protection Strategy
Defensive stocks withstand economic recessions and bear markets by providing critical human services. The best way to find defensive stocks is by using Benjamin Graham's timeless rules for the defensive investor: Stability, earnings, dividends, price-to-book ratio, and the price-to-Graham number.
Our Best Training & Strategies
Liberated Stock Trader Pro: Learn Stock Market Investing
Learn stock market investing with the complete online stock trading course by Barry D. Moore, a certified financial analyst from the International Federation of Technical Analysts (IFTA).
ETF Investing Strategy: MOSES Improves Performance & Lowers Risk
The MOSES ETF investing strategy is a powerful suite of indicators meticulously backtested over 100 years. Designed to empower you to outperform the market, it equips you with the tools to navigate major stock market crashes and unlock greater investing performance.
Our LST Strategy Beat the Stock Market’s S&P 500 By 102%...
Decades of research and testing unveiled the Liberated Stock Trader Beat the Market System. Our 9-year, backtested, and proven strategy targets 35 financially healthy high-growth stocks, producing a track record of beating the S&P 500 by 102%.



![Stock Market Beginner’s Guide [2024 Elite Investor Edition] Stock Order Types: Using Market, Limit & Trailing Stops in Trading](https://www.liberatedstocktrader.com/wp-content/uploads/2022/04/stock-trading-answers-324x235.jpg)
