The Parabolic Stop and Reverse (PSAR) technical chart indicator identifies asset price reversals. Parabolic time/price systems can create effective trailing stop-losses for trading signals.
Is the Parabolic SAR a profitable indicator, and if so, how should you use it to become a profitable trader? Buckle up for this incredible deep dive into trading the PSAR indicator.
I backtested seven Parabolic SAR trading setups from 1-minute to daily charts across the DJ30 stocks over 12 years, equaling over 2,880 years of testing data. On standard charts, PSAR is not a profitable trading indicator. However, I did discover the most profitable PSAR configuration.
KEY TAKEAWAYS
- Parabolic SAR identifies changing trends and determines whether a trader should enter or exit their position.
- The Parabolic SAR indicator relies on the concept of parabolic time/price systems.
- The Parabolic SAR is displayed as a series of small dots above or below the price.
- When the dots are above the price, this indicates a downtrend. When the dots are below the price, this indicates an uptrend.
- The Parabolic SAR is also used to determine when to place stop-loss orders.
What is Parabolic SAR?
Parabolic SAR (Stop and Reverse or PSAR) is a technical indicator used to identify potential reversals in an asset’s price. It relies on the concept of parabolic time/price systems, which create trailing stop-losses for long or short positions. The Parabolic SAR is displayed as a series of small dots placed either above or below the price of an asset, which helps traders identify where to place their stop-loss orders. It is a popular tool for traders looking to quickly enter and exit market positions.
The Parabolic SAR system created by Welles Wilder is a popular trading system that gives clear buy and sell signals. The SAR in the name means “Stop and Reverse.” It is a momentum indicator that gives traders signals based on the momentum of an asset’s price movement.
How to Trade Parabolic SAR?
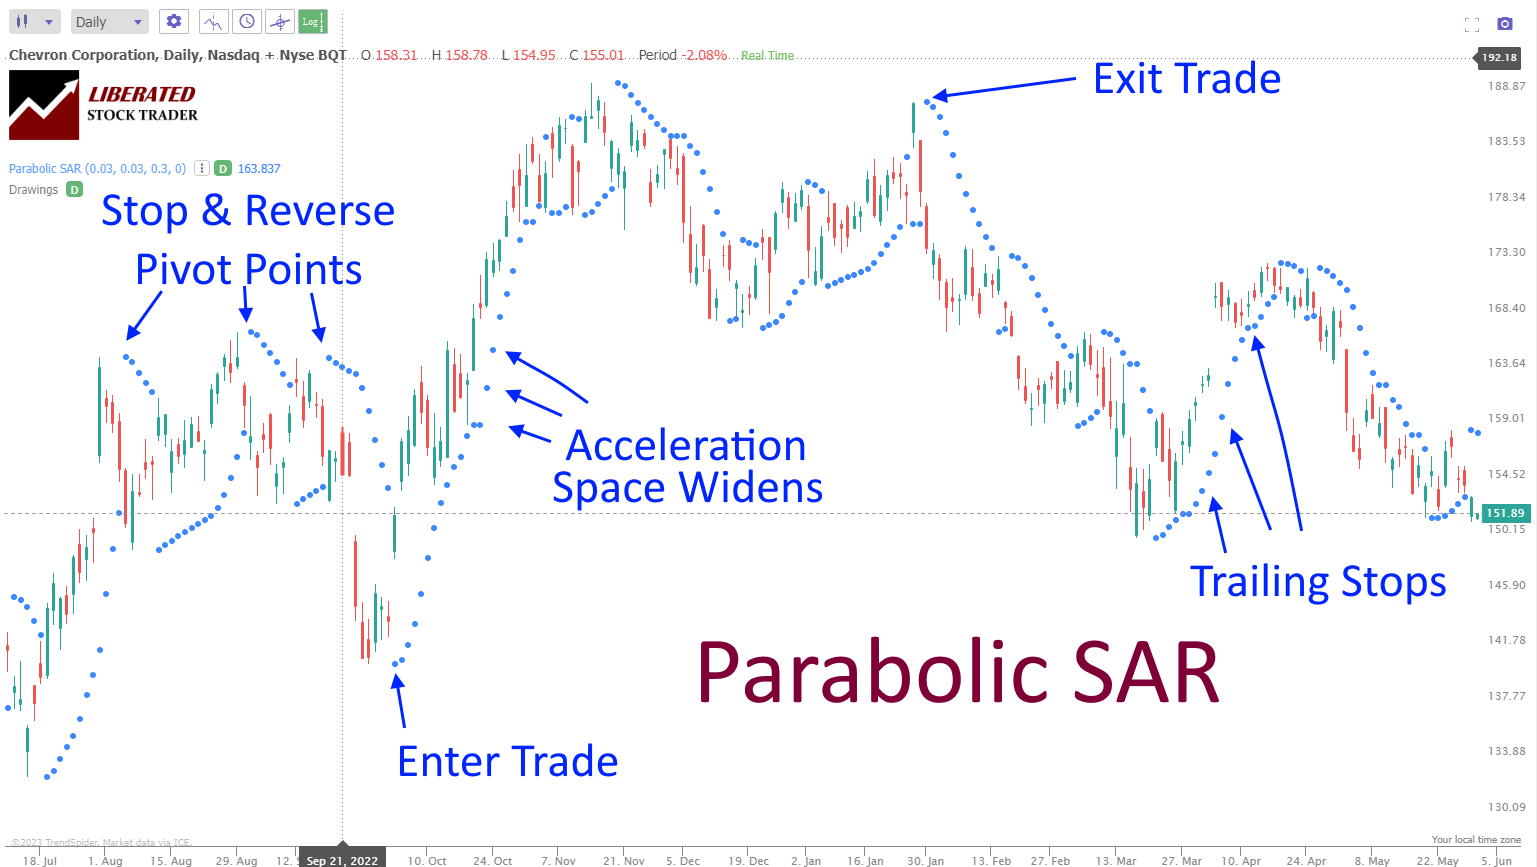
The Parabolic SAR provides four valuable insights to traders: stop and reverse points, trade entry and exit signals, trend acceleration/deceleration, and trailing stop targets. The chart below provides pointers on each.
Powerful PSAR Charts with TrendSpider
Stop and reverse pivot points.
This is the precise pivot point where the PSAR dot moves from above to below the candle, signaling a potential trend direction change.
Trade entry & exit signals.
The appearance of dots above or below the candle body forms a signal for entering/exiting trades. Dots above the candle body signal a buy entry and a sell below.
Trend acceleration/deceleration.
A PSAR dot accelerating in its movement away from the price indicates an increasingly strong trend. Conversely, if it begins to flatten out or decelerate, the market may be entering a consolidation or trading range phase.
Trailing stop targets.
A trailing stop is a method of following the trend and protecting profits by using technical analysis to set markers that move in the direction of the trade, usually placed at key support or resistance levels as identified on the chart. This allows for an exit if the markets turn against you but also ensures that you don’t miss out on any additional gains if the trend continues.
The Parabolic SAR system gives traders signals based on an asset’s price movement momentum. When an uptrend is identified, the trader should wait for a signal from the PSAR below the current price to enter a long position. In a downtrend, they should wait for prices to break above the PSAR and enter a short position.
My thorough testing awarded TradingView a stellar 4.8 stars!
With powerful stock chart analysis, pattern recognition, screening, backtesting, and a 20+ million user community, it’s a game-changer for traders.

Whether you're trading in the US or internationally, TradingView is my top pick for its unmatched features and ease of use.
Explore TradingView – Your Gateway to Smarter Trading!
Understanding the Parabolic SAR Strategy
To understand PSAR, you must grasp the four variables that determine its behavior: extreme point, acceleration factor, max acceleration, and step.
- The extreme point (EP): This is the highest or lowest point the price reaches before the current time period.
- Acceleration factor (AF): This is the speed at which the indicator moves away from the EP.
- Max Acceleration (MA): The maximum acceleration is the highest value the AF can reach.
- Step (S): The minimum distance between two SAR points should be set according to one’s trading style and time frame.
When using the Parabolic SAR system, traders will spot an asset’s price trend and then use the SAR to determine potential buy or sell signals. The SAR signal is represented by a dot above or below the price. If the SAR is below the asset’s price, it implies a bullish trend that traders should consider buying. On the other hand, if the SAR is above the asset’s price, it implies a bearish trend and a selling opportunity.
1. Parabolic SAR extreme point (EP)
The Parabolic SAR system also uses a concept called “acceleration factor” (AF) to determine the speed at which the indicator moves away from the extreme point (EP). The AF is calculated as the difference between two successive SAR points divided by the previous S step. If AF is greater than the maximum AF value, then it should be set to the maximum AF value. The Parabolic SAR extreme point (EP) is a trend’s highest or lowest price before its reversal. Traders can use this to identify potential buy and sell points based on current trends or to place stop-loss orders along the trend. For example, a trader may look for a bullish reversal when the current price exceeds the SAR extreme point.
Similarly, a bearish reversal is identified if the current price falls below the SAR extreme point. This can provide traders insight into potential buying and selling opportunities along the trend. Additionally, stop-loss orders can be placed at or near the SAR extreme point to ensure a trader is not caught off guard by sudden reversals in price.
2. Parabolic SAR Acceleration factor (AF)
The Parabolic SAR Acceleration factor (AF) is also a key element in the indicator. The AF rate determines how quickly the SAR extreme points move relative to price movements. A higher AF means the SAR extreme points will move more quickly, while a lower AF results in slower changes to the SAR extreme points. This can be useful for traders who want to take advantage of short-term price movements or traders who want to play the long game and prefer slower changes in extreme points.
3. Parabolic SAR Time Periods/Max
The periods used to calculate the Parabolic SAR indicator can also be adjusted by the trader. Generally, shorter time frames, such as 1-minute or 5-minute charts, are best suited for day trading strategies, while longer time frames, such as 4-hour or daily charts, are more appropriate for swing trading.
4. Parabolic SAR Indicator Settings
The Parabolic SAR indicator has adjustable settings that can be used to fine-tune the indicator’s performance. These settings include “acceleration” (which determines how quickly the indicator moves based on price action) and “maximum” (which limits the maximum number of points in a trend). By adjusting these settings, traders can optimize the performance of their Parabolic SAR trading strategy.
How to Calculate Parabolic SAR
Parabolic SAR is automatically calculated using charting software like TrendSpider or TradingView. But if you want to understand the calculation, read on.
The Parabolic SAR indicator is calculated by first determining the direction of the trend. If the price rises, a buy signal is generated, and vice versa for falling prices. The acceleration factor (AF) then increases or decreases based on the trend direction. Each new point will be higher than the previous one in an uptrend, and when in a downtrend, each successive point will be lower.
The Parabolic SAR indicator is then calculated by taking the most recent high or low (depending on the trend direction), adding it to the current AF, and multiplying by the difference between that high or low and the previous one. The result is then added to an exponential moving average of price data to determine the SAR. The SAR is then plotted as a series of dots above or below the price, depending on its trend direction.
For example, if the current high is 30 and the previous high is 20 with an AF of 0.02, the next point would be calculated by taking 30 + (0.02 x 10) = 30.2. This new point is then added to the exponential moving average of the price data to determine the SAR for that period, plotting above or below the price, depending on whether it is in an uptrend or a downtrend. This process continues until there is a reversal in trend direction or until the price reaches the current SAR level, in which case the SAR will flip sides. Knowing when to buy and sell based on the SAR can help traders identify entry and exit points for their trades and inform them of potential changes in the trend direction.
The Parabolic SAR Formula
The formula for calculating the SAR is relatively simple and involves multiplying the AF by the difference between the high of the previous period and the current SAR. This result is then added to the earlier SAR value to get the new SAR:
SARt = SARt-1 + AF x (EP – SARt-1)
Where:
- SARt = The SAR for the current period
- SARt-1= The SAR from the previous period
- EP = Extreme point (highest high of the uptrend or lowest low of the downtrend)
- AF = Acceleration Factor. This is a number between 0 and 0.2, increasing by 0.02 each time the price reaches a new extreme point.
Using this formula, traders can easily calculate how much the SAR will move with each period and adjust their trading accordingly. For example, if the previous high is $100 and the current SAR is $90, then the AF x (EP – SARt-1) calculation would be 0.02 x ($100 – $90) = $2 which would be added to the SARt-1 value of $90 to give a new SAR of $92. By understanding how much the SAR will move with each period, traders can plan their trades and gain an advantage.
Pros
The main benefit of Parabolic SAR is that it helps traders identify trends and determine when to enter or exit trades. By tracking the price movements and using the AF to calculate how much the SAR will move each period, traders can stay one step ahead of the market. Furthermore, since the indicator is visually simple to understand and use, it can be used by both beginner and experienced traders.
Cons
One of the drawbacks of Parabolic SAR is that it produces false signals in range-bound markets. Additionally, since the indicator doesn’t consider other factors, such as volume or momentum, it can sometimes lead traders to enter trades at unfavorable times. Lastly, since the indicator only tracks price movements and doesn’t factor in economic news or other variables, relying solely on it for trading decisions can be unprofitable.
Despite its drawbacks, Parabolic SAR is still useful for traders of all levels as it provides easy-to-spot entry and exit points. By utilizing the indicator alongside other analysis tools, such as trend lines and technical
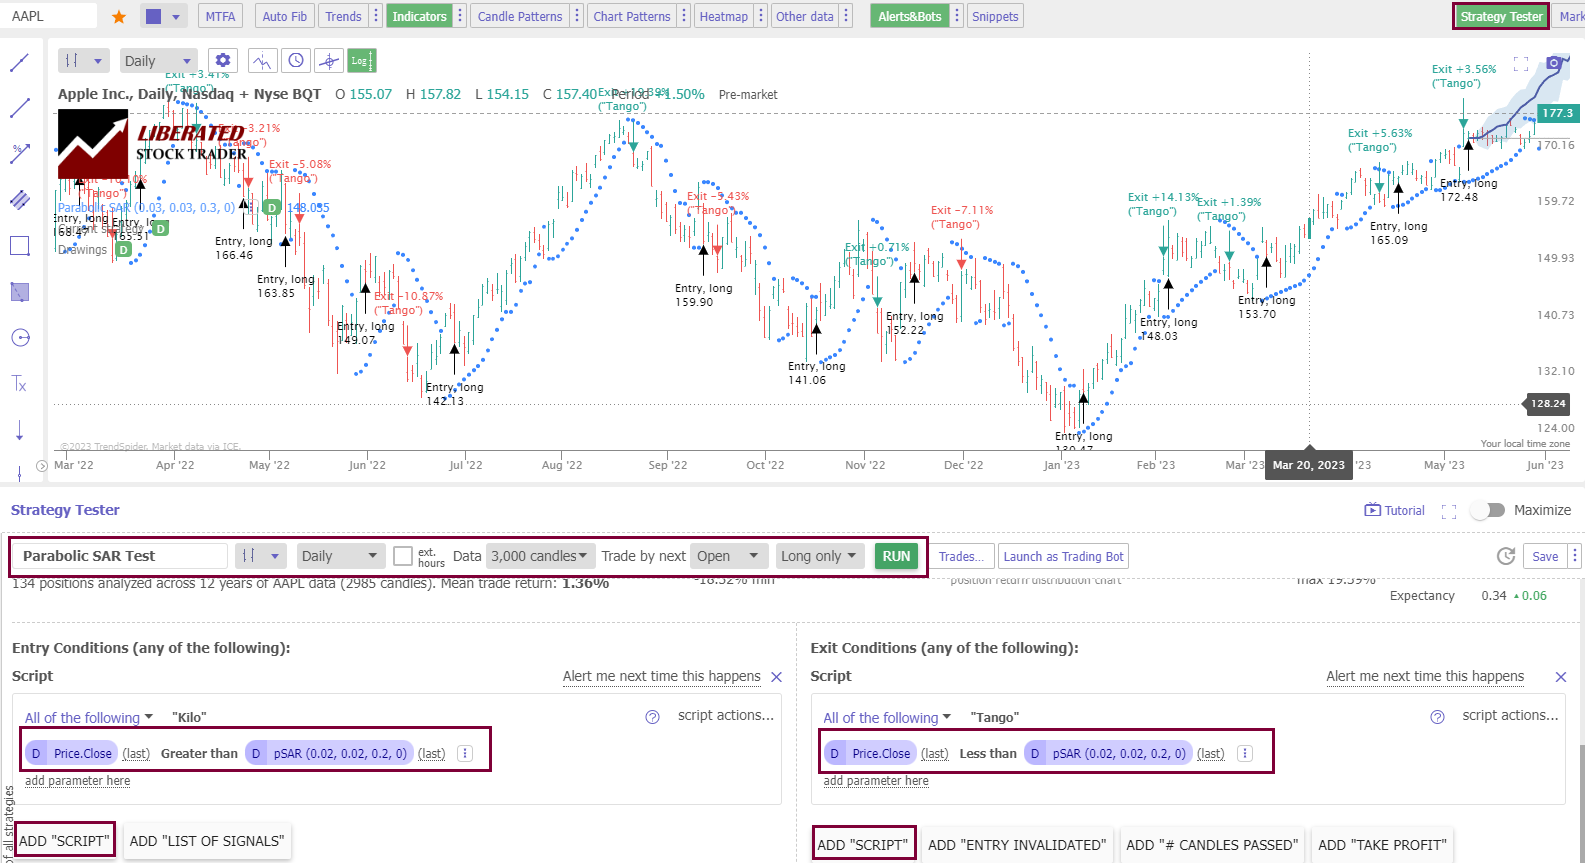
How to Set Up a Parabolic SAR Backtesting
To set up PSAR backtesting in TrendSpider, follow these steps:
- Register for TrendSpider.
- Select Strategy Tester > Entry Condition > Add Script > Add Parameter > Condition > Price > Greater Than > pSAR.
- For the Sell Criteria, select > Add Script > Add Parameter > Condition > Price > Less Than > pSAR.
- Finally, click “RUN.”
Backtest Your Strategies on TrendSpider Now
Using the award-winning TrendSpider software, we can easily test any indicator, chart pattern, or chart performance on any US stock. Our Trendspider review reveals it offers the most powerful trading strategy development and testing service.
Parabolic SAR Testing Methodology
| PSAR Testing Criteria | Daily OHLC Chart | Daily Heikin Ashi Chart |
| Index: | DJIA | DJIA |
| Date Range | 12 Years/5000 Candles | 12 Years/5000 Candles |
| Settings: | 0.02,0.02, 0.2 0.02,0.01, 0.1 0.03,0.03, 0.3 |
0.02,0.02, 0.2 0.02,0.01, 0.1 0.03,0.03, 0.3 |
| Entry Criteria: | Price > PSAR | Price > PSAR |
| Exit Criteria: | Price < PSAR | Price < PSAR |
| Sell: | Next Open | High+Low/2 |
A 12-Year Parabolic SAR Indicator Test
Our testing of Goldman Sach (Ticker: GS) over 12 years shows a PSAR strategy with settings 0.03, 0.03, and 0.3 on a daily OHLC chart, returning a profit of +359% versus the buy-and-hold return of 159%. There were 168 trades with an average win of 5.78% versus a loss of -2.81%.
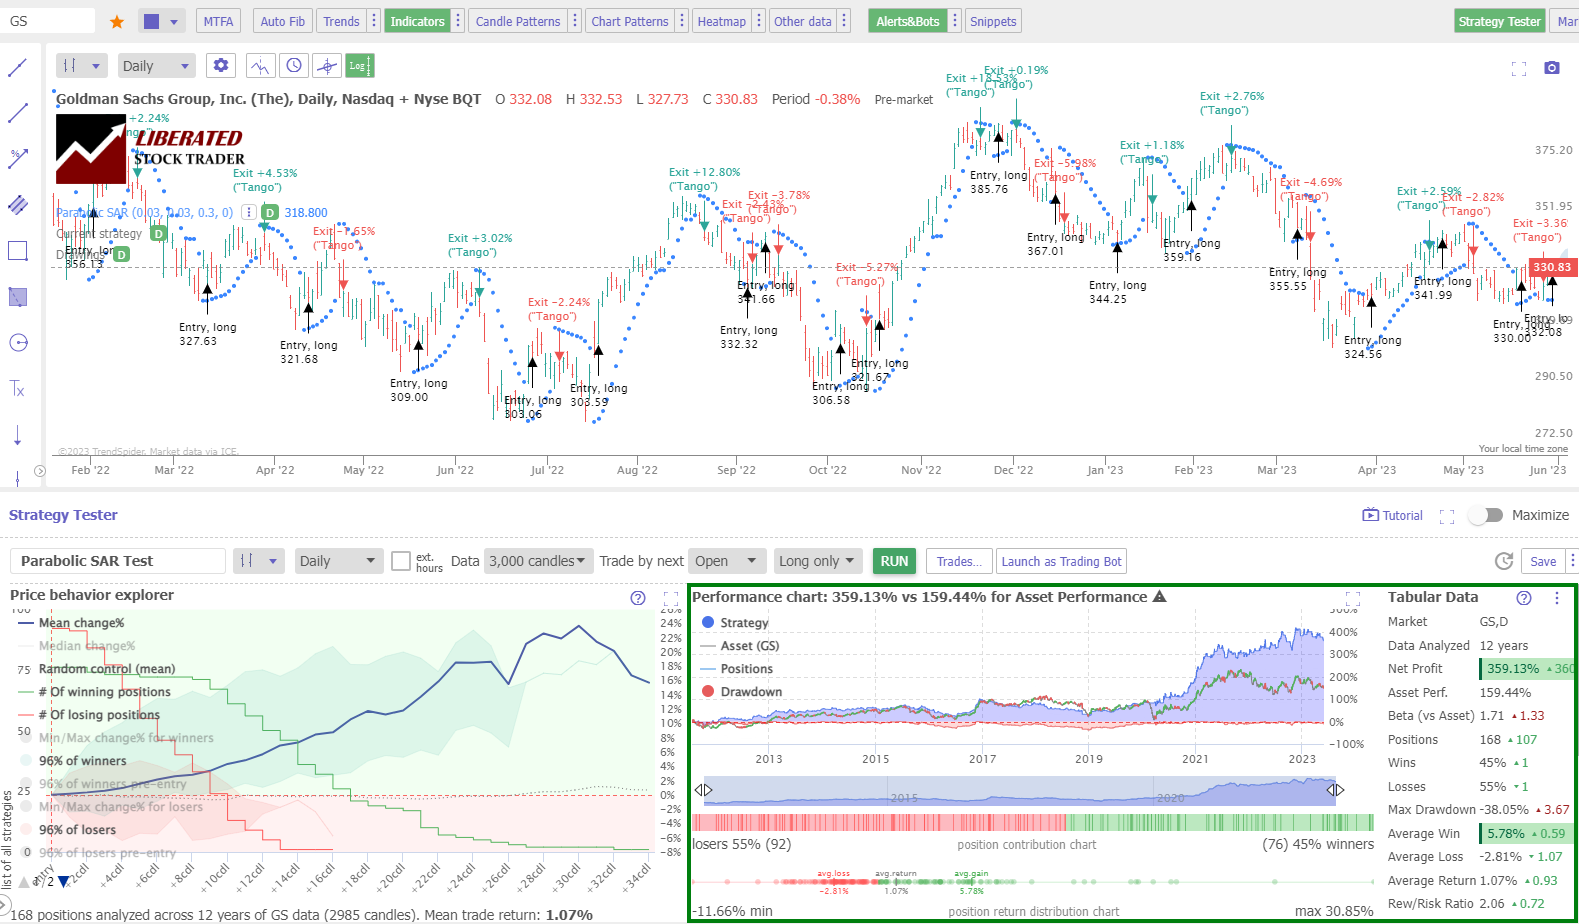
This was an impressive result, although not typical of all stocks in the test.
A 12-Year Parabolic SAR Test on a Heikin Ashi Chart
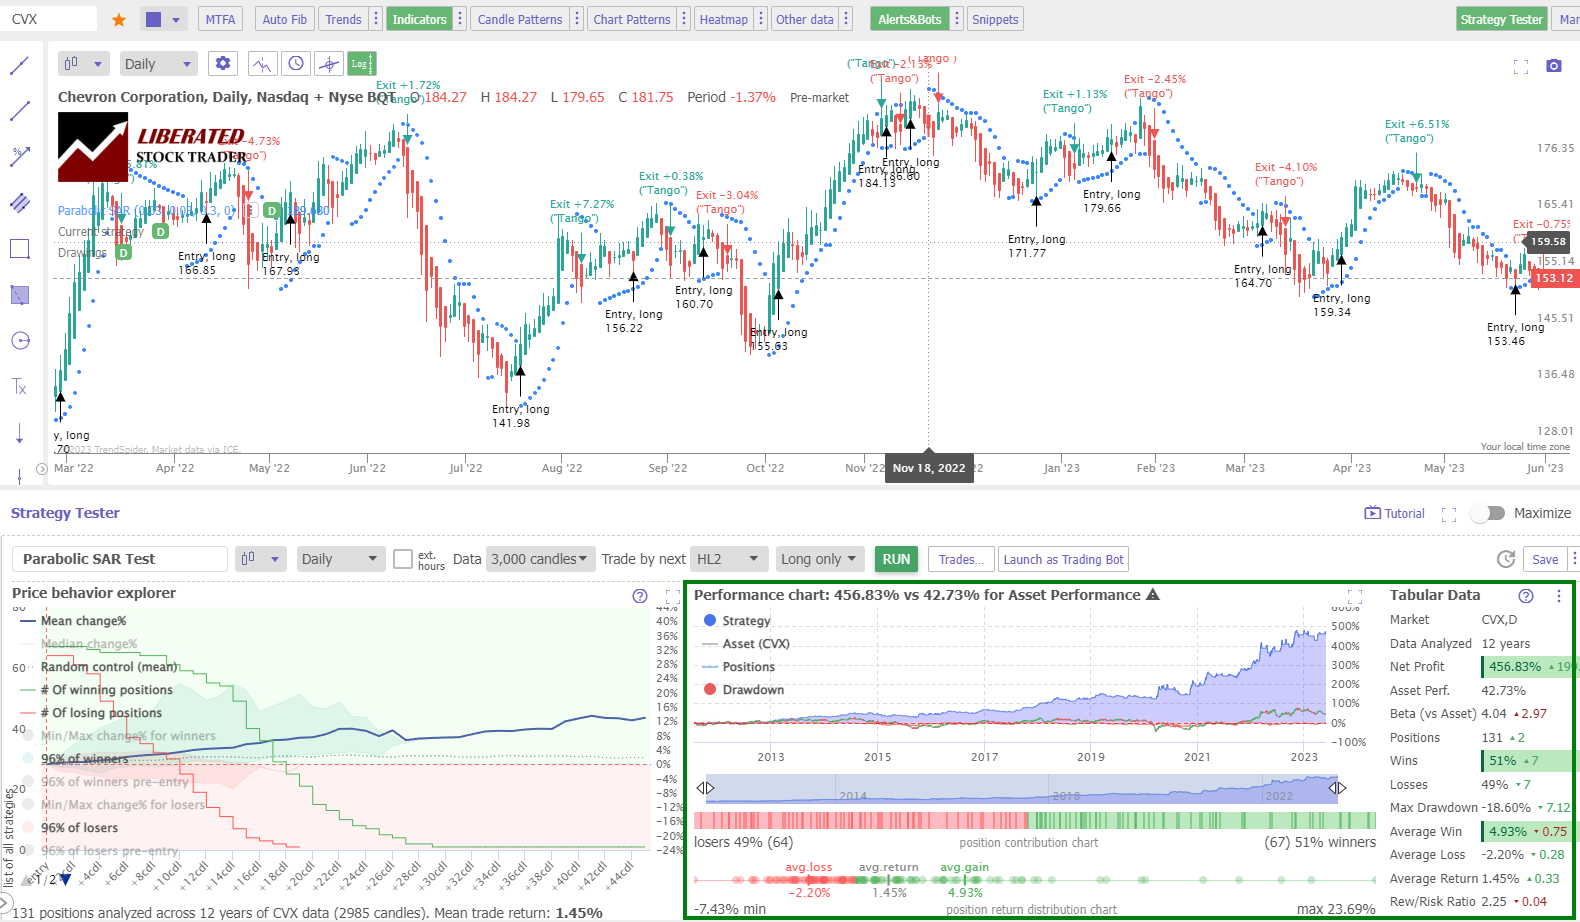
Our testing of Chevron Corp. over 12 years shows a PSAR strategy returned a profit of +456% versus the buy and hold return of 42%. This is a vastly superior return versus the market, and this difference is down to the smoothing effect of Hekin Ashi Candles. There were 131 trades with an average win of 4.93% versus a loss of -2.22%.
Get Point & Click Backtesting on TrendSpider
Parabolic SAR Backtest Results
After testing seven variations of PSAR over 12 years on 30 stocks, the results suggest it should not be used as a standalone indicator on a candlestick/OHLC chart.
PSAR, on a candlestick/OHLC chart, produced very poor performance on all timeframes from 1, 5, and 60-minute to daily charts. The average percent of stocks beating a buy-and-hold strategy with PSAR was only 19%, meaning 81% of long-term investors would have outperformed this indicator.
| Parabolic SAR Setting | Chart | Duration | % Winners | Avg # Trades |
| OHLC Chart: 0.02, 0.02, 0.2 (Standard) | Daily | 12 Years | 30% | 174 |
| OHLC Chart: 0.02, 0.01, 0.1 | Daily | 13 Years | 17% | 101 |
| OHLC Chart: 0.03, 0.03, 0.3 | Daily | 14 Years | 17% | 178 |
| OHLC Chart: 0.02, 0.02, 0.2 (Standard) | 1-min | 20 Days | 10% | 218 |
| OHLC Chart: 0.02, 0.02, 0.2 (Standard) | 5-min | 3 Months | 17% | 227 |
| OHLC Chart: 0.02, 0.02, 0.2 (Standard) | 1-hour | 3 Years | 23% | 199 |
| OHLC Chart Average | 19% | 183 | ||
| Heikin Ashi Chart: 0.02, 0.02, 0.2 (Standard) | Daily | 12 Years | 63% | 129 |
The Best Parabolic SAR Settings
Our 2,880 years of backtests revealed conclusively that the best settings for Parabolic SAR are using the standard 0.02, 0.02, 0.2 in conjunction with Heikin Ashi charts, which produced a 63% win rate. The win rate using OHLC/candlestick charts with PSAR is 19%.
Why are Heikin Ashi’s PSAR results better?
Why do Heikin Ashi charts perform better with Parabolic SAR and other indicators like KDJ and Price Rate of Change? Price averaging removes the extreme price highs and lows associated with traditional OHLC bars. This means fewer trades in consolidating markets and fewer small losses.
Professional traders may assume, as I did, that the Heikin Ashi chart distorts the pricing because it averages the OHLC of the candles. However, we can achieve realistic entry and exit criteria using TrendSpider’s HL2 setting, which means the average price of candles is high and low. I proof-checked individual trades, which were reasonable but not entirely realistic.
Combining PSAR with Other Indicators
Incorporating Parabolic SAR with additional chart indicators, such as Price Rate of Change or bullish chart patterns, is optimal. The PSAR excels in markets trending either up or down. However, it provides multiple false buy and sell signals during consolidation, leading to many minor trading losses. Therefore, avoid using this indicator in consolidating markets.
Can PSAR be used for buy and sell signals?
Over 2,880 years of data across 30 Dow Jones stocks, our research shows that the standard PSAR setting of 0.02, 0.02, 0.2 on a Heikin Ashi chart is the only configuration for identifying profitable buy and sell signals with a 63% success rate.
Limitations of Using Parabolic SAR
The biggest limitation of Parabolic SAR is it produces 55% of losing trades on a standard OHLC chart. Like most indicators, it does not perform well in consolidating markets. Using the smoothing effects of a Heikin Ashi chart changes the results from a 19% win rate to a 63% win rate.
Summary: Trading Parabolic SAR
After testing 2,880 years of data, it’s safe to say that using Parabolic SAR as a trading indicator on OHLC charts for buying and selling is a losing strategy. Only use this indicator on Heikin Ashi charts to improve your chances of trading profitability.
FAQ
Is the Parabolic SAR a good indicator?
No, our research shows that Parabolic SAR is not a good indicator on any timeframes on OHLC charts producing only a 19% success rate. However, using Parabolic SAR on a Heikin Ashi chart has a 63% win rate.
What is the best setting for a Parabolic SAR?
Our testing shows that the best setting for Parabolic SAR is the standard 0.02,0.02, 0.2 on a Heikin Ashi chart, which yields a 63% win rate. A Parabolic SAR on OHLC or candlestick charts is not recommended as the best setting of 0.02,0.02, 0.2 has only a 30% success rate.
What are better indicators than Parabolic SAR?
There are many better indicators than Parabolic SAR, such as the rate of change and chart patterns. Our testing has proven these indicators to be much more effective, work on many timeframes, and are more successful in trading strategies.
Is a Parabolic SAR the best indicator?
No, the Parabolic SAR is not the best indicator; it is a weak indicator in technical analysis. It generates 81 percent losing trades when trading the Dow Jones Industrial Average stocks. I recommend learning to backtest and tune trading strategies.
What is the best timeframe for Parabolic SAR?
The best timeframe for a Parabolic SAR strategy is a daily Heikin Ashi chart with standard PSAR settings of 0.02, 0.02, and 0.2, which yields a 63 percent win rate, according to our testing. We conducted time-based research and found that Parabolic SAR underperformed the market on all timeframes on all candlestick charts.
How reliable is a Parabolic SAR?
Parabolic SARs are an unreliable technical analysis chart indicator. Our 2,880 years of backtested data on 30 major US stocks show a 19% chance of beating a buy-and-hold strategy on a daily OHLC chart. Results were better using a Heikin Ashi chart, as the standard Parabolic SAR setting had a 77% reliability.
What is the best software for trading and testing Parabolic SAR?
After thoroughly analyzing Parabolic SAR trading, we utilized TrendSpider, an industry-leading trading tool for backtesting and strategy development. As a professional, in my opinion, it proved invaluable.
Which is better, a Parabolic SAR or moving averages?
Based on 2,880 years of backtesting data on 30 stocks, our research indicates that the Parabolic SAR outperforms moving averages with a 19% win rate vs. the SMA's 12%. Both indicators have poor success rates and are not recommended for traders on standard charts.
How to read a Parabolic SAR chart?
Parabolic SAR charts are easy to read and interpret. They consist of a series of dots representing price action points. When the dots form above the candlesticks, it indicates a bearish trend; when they form below the candlesticks, it indicates a bullish trend. The larger distance between dots, the stronger the trend.
Is the Parabolic SAR the same as a moving average?
No, a Parabolic SAR is not the same as a moving average. There are four main moving averages; simple, exponential, weighted, and Hull. The Parabolic SAR is a completely original concept, calculation, and success rate.
Does Parabolic SAR work?
Yes, Parabolic SAR works very well, but only with a specific configuration using Heiking Ashi charts on a daily timeframe. This setup is tested to have a 63% success rate. All other standard settings on OHLC charts are not profitable.
How accurate is a Parabolic SAR?
The Parabolic SAR indicator is highly inaccurate, especially with a standard OHLC, line, or candlestick chart. Our research indicates that a Parabolic SAR has a 10 to 30 percent win rate. Although moving averages, MACD, and PSAR are marketed as good strategies, the rate of change indicator is more effective at 66 percent.
How to make money trading Parabolic SAR?
Our research demonstrates that making money using Parabolic SAR is unlikely because this indicator generates many losses during market consolidations. The PSAR average win rate is 19% meaning you will lose money on 81% of your trades on a standard configuration.
How to use Parabolic SAR with Crypto or Forex?
You can use Parabolic SAR with cryptocurrency or Forex trading, but our tests show the results are poor, with only a maximum success rate of 30% on a standard 0.02, 0.02, 0.2 setting. Whether you choose stocks, crypto, or forex for trading, you must avoid the Parabolic SAR strategy.
Is the Parabolic SAR effective for day trading?
No, Parabolic SAR is not effective for day trading. Our test results on 1-minute, 5-minute, and 60-minute charts prove only an average 17 percent success rate using the recommended standard settings.
Hello,I find out that your weblog is really informative and useful and we wonder if there is a possibility of acquiring More articles like this on your site. If you willing to aid us out, we will be willing to compensate you… Sincerely, Rosy Rodriuez
I’ve become a passionate admirer of this site for a while but not really given nearly anything back, I hope to change that later on with more discussion.Thanks for another new inclusion to your website.