A Keltner Channel is a volatility-based trading indicator that plots a channel on a chart by combining a simple moving average, exponential moving average, and average true range. It identifies trading signals using overbought and oversold conditions.
But do Keltner Channels provide traders with valuable buying and selling signals? I tested the Keltner Channel indicator on 1, 5, 60-minute, and daily charts with five different settings to see if it works.
Mainstream investing websites regurgitate the standard strategies for this indicator, but no original research is done to test if these strategies are successful.
My reliability testing of Keltner Channels on 1,800 years of DJIA data suggests it is not a good indicator. However, it is profitable with the optimal settings.
My 1,800 years of backtesting reveal the reality of using this chart indicator; this is an incredible insight for any technical trader.
Key Takeaways
- Keltner Channels are a technical analysis indicator used in the stock market to identify potential buy and sell signals.
- The channel is calculated based on an Exponential Moving Average (EMA) of price and a multiple of the Average True Range (ATR).
- Price action near the bands can provide clues about potential trend reversals.
- A breakout from either side of the channel may signify strength or weakness in the underlying security.
- Keltner Channels are a poor indicator with an average 28% win rate.
What are Keltner Channels?
The Keltner Channel is a technical analysis indicator that helps traders identify entry and exit points in the market. It comprises an upper band, a middle band, and a lower band. The bands are based on the Average True Range (ATR), which measures market volatility over a given period. This volatility can determine whether the price is overbought or oversold, providing valuable buying and selling signals for traders.
The Keltner Channel was developed in the early 1960s by Chester W. Keltner, a grain trader who wanted to quantify the prevailing trend.
Keltner Channel Logic
The logic behind the Keltner Channel indicator is that it may be time to buy or sell when prices move above or below the upper or lower bands. These movements outside the channel suggest that price momentum is shifting, and it may be time for traders to adjust their positions accordingly. Additionally, if prices stay within the Keltner Channel without breaking through either boundary, this could indicate sideways movement, signaling consolidation before another move higher or lower.
Keltner Channels use an exponential moving average (EMA) to mark the support and resistance levels. It is based on the average true range (ATR), which measures the market’s volatility. The EMA plot is divided into three bands or channels. The center line is usually a 10-period EMA, while the upper and lower bands are plotted twice the ATR away from it.
Keltner Channels help traders identify potential breakouts and indicate the strength of a trend. When the price breaks out above or below the channel, it signals a possible move in that direction.
My thorough testing awarded TradingView a stellar 4.8 stars!
With powerful stock chart analysis, pattern recognition, screening, backtesting, and a 20+ million user community, it’s a game-changer for traders.

Whether you're trading in the US or internationally, TradingView is my top pick for its unmatched features and ease of use.
Explore TradingView – Your Gateway to Smarter Trading!
How do Keltner Channels Work?
Keltner Channels can be used to identify potential breakouts, which could signal consolidation before another move higher or lower. Traders will look for a breakout and then observe the direction of the trend after the breakout. A strong upward trend following a breakout above the channel may indicate momentum in that direction, and traders may consider buying. Conversely, a strong downward trend following a breakout below the channel may indicate that traders should consider selling.
Keltner Channels can also identify signs of exhaustion in a move and potential reversals. If the price moves up to the upper band and then falls back down, it could signal that buyers are losing interest, and the trend could be reversed. Similarly, if the price moves down to the lower band and then bounces back up, it could signal that sellers are losing interest, and the trend may also reverse direction. Traders should watch for these signs of exhaustion when using Keltner Channels to trade.
Keltner Channels can also be used to gauge volatility. If the channel lines are close together, the price is at low volatility. Conversely, if the channel lines widen out, it could indicate increased volatility. As a trader, you would want to consider this when deciding which trades to place and how aggressive you should be with your position size.
Finally, Keltner Channels can provide a visual representation of support and resistance. If the price approaches the upper or lower band, it could indicate that pushing through that level is likely to be difficult, which could make you more cautious about entering a trade. On the other hand, if the price breaks out from either side of the Keltner Channel, it may signify strength or weakness in the underlying security.
Using other analysis techniques with Keltner Channels is important to comprehensively understand any given security. With all these points considered, Keltner Channels can be an invaluable tool for any trader who wants to increase their chances of success in the stock market.
Pros
Keltner channels provide a way to identify breakouts in the market, as well as indicate when to enter and exit trades. By measuring price action through the ATR, Keltner channels can provide indicative signals regarding trend changes that may give traders greater profit opportunities and reduced risk.
Cons
The main disadvantage of Keltner channels is that they can be prone to false signals. Our testing shows that they are completely unprofitable across all timeframes and settings. ATR fails to accurately measure a change in trend, resulting in traders entering and exiting trades too late or too early.
How to Trade Keltner Channels
We tested the many ways to trade Keltner Channels, but the research shows that none are more than 37% successful. This is because Keltner Channels produce many false signals.
Trading Strategy 1. Buy Oversold & Sell Overbought.
The first Keltner Channel trading strategy I tested is to buy when the price crosses above the lower band (Oversold) and sell when it crosses below the upper band (Overbought). This is a momentum strategy that relies on the assumption that prices will continue in the same direction. This strategy works for Bollinger Bands to some extent, but Bollinger Bands is also a poor-performing indicator.
We independently research and recommend the best products. We also work with partners to negotiate discounts for you and may earn a small fee through our links.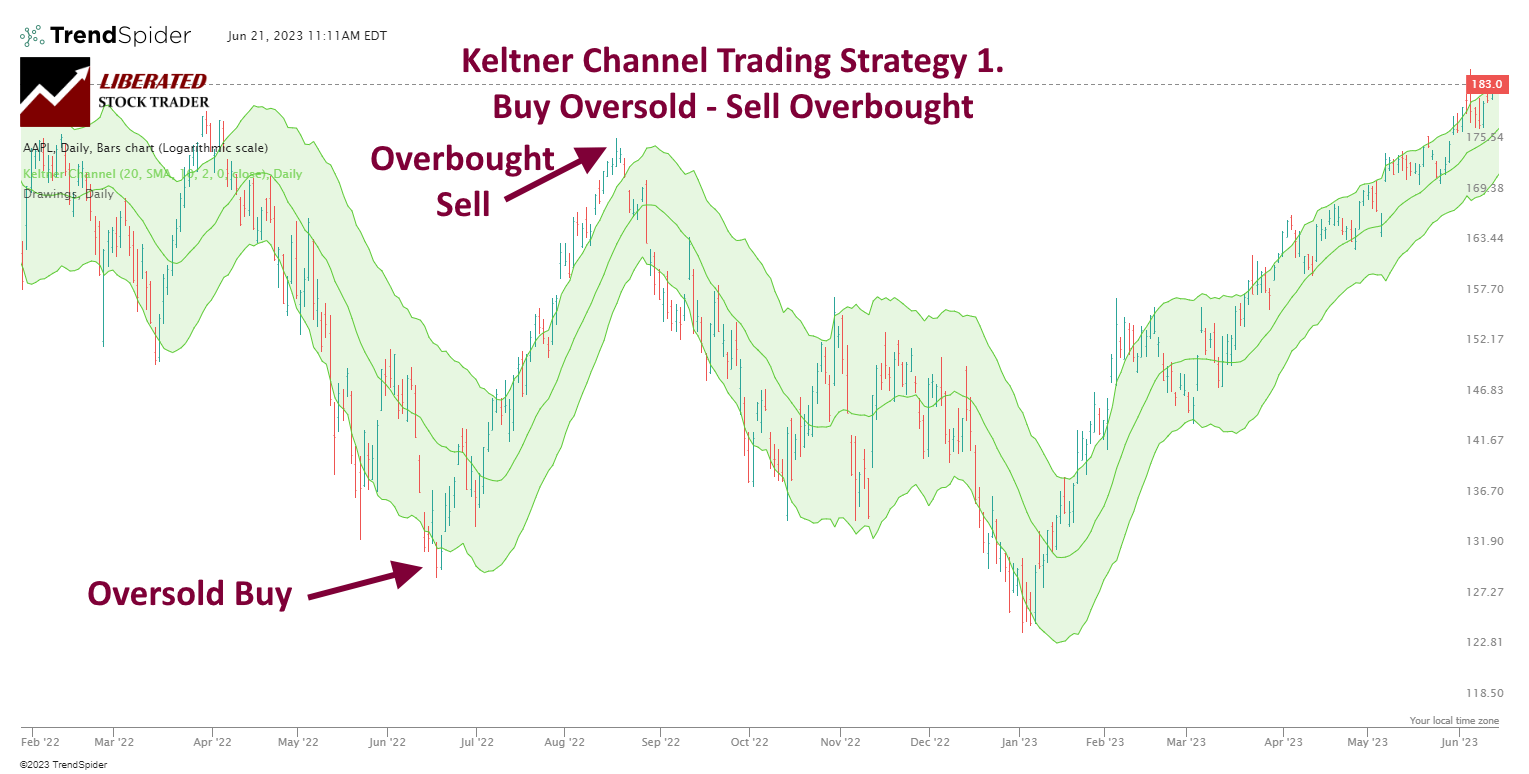
Chart Produced with TrendSpider
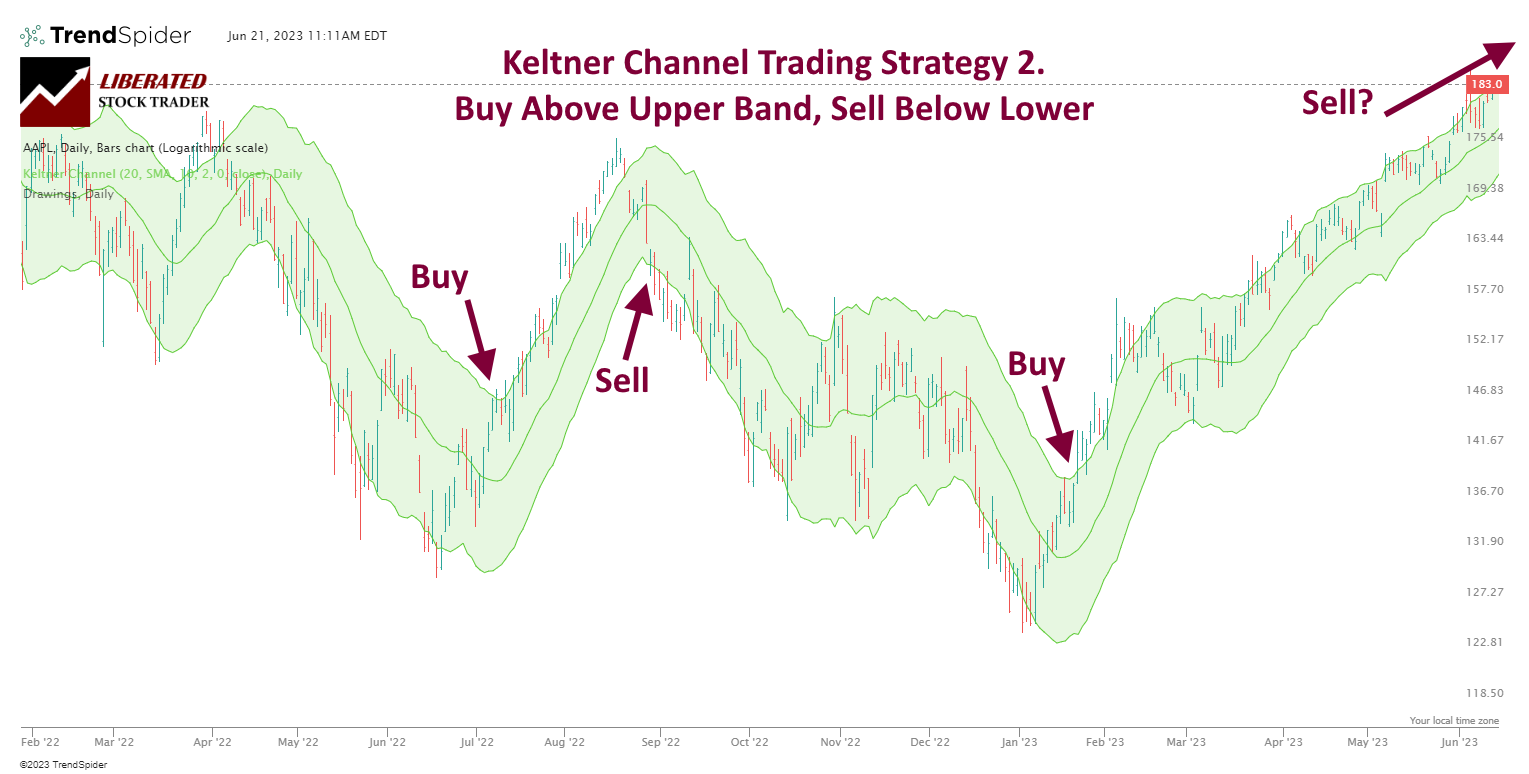
Trading Strategy 2. Buy Overbought & Sell Oversold
We tested another popular Keltner Channel trading strategy: to buy when the price is above the upper band (Overbought) and sell when the price crosses below the lower band (Oversold).
Short-term Trading
To read Keltner Channels for a short-term trading strategy, look for breakouts outside the bands. If the price breaks above the upper band, traders can enter a long trade, and if it breaks below the lower band, they can enter a short trade. This strategy is best avoided when markets are ranging or consolidating, as there will be more opportunities for false breakouts and losing trades.
Finally, traders can use Keltner Channels to identify reversals in the market. If the price touches the lower band and reverses higher, traders can enter a long trade, and if it touches the upper band and reverses lower, they can enter a short trade. This strategy works best when markets are ranging or consolidating – in these conditions, Keltner Channels act like support and resistance levels.
With this strategy, traders may look for additional signals to confirm the reversal. This could include using other indicators or chart patterns, such as a double bottom or candlestick pattern. Traders should also pay attention to volume when trading with Keltner Channels – higher volume often confirms a valid reversal signal.
Although these Keltner Channel trading strategies are popular, we could not demonstrate any success with our testing.
But the big question is, are Keltner Channels’ buy and sell signals profitable, like the RSI indicator, or are they another chart indicator that does not work, such as moving averages?
Calculation
The Keltner Channels are calculated using a simple or exponential moving average (SMA) and the Average True Range (ATR). The Moving Average is set at a certain period, such as 10 or 20, while the ATR measures volatility.
There are three lines: the upper and lower channel and the central moving average channel.
Formula:
The Keltner Channel Formula is calculated by taking the exponential moving average of a particular period (typically 10 or 20 periods) and then adding and subtracting the Average True Range (ATR) multiplied by a “multiplier” value. This multiplier will affect how wide or narrow the channel is, with a wider channel being more volatile. The formula takes the following form:
Upper Channel = EMA + (Multiplier x ATR)
Lower Channel = EMA – (Multiplier x ATR)
Central Channel = EMA
Where:
- EMA = Exponential Moving Average
- ATR = Average True Range
- Multiplier = a number, typically between 1 and 3. A higher multiplier leads to a wider channel, whereas a lower multiplier results in a narrower one.
- ATR, or Average true range, is a technical analysis indicator that measures market volatility. It is calculated by taking the difference between the daily high and low price and averaging it over a set number of periods (typically 10 or 20). ATR can be used to identify breakouts in trend-following strategies and indicate when to enter and exit trades.
How I Set Up Keltner Channel Backtesting
We used TrendSpider to set up the two main Keltner Channels strategies and enable a scientific approach to backtesting this indicator. To reproduce these tests, follow these steps.
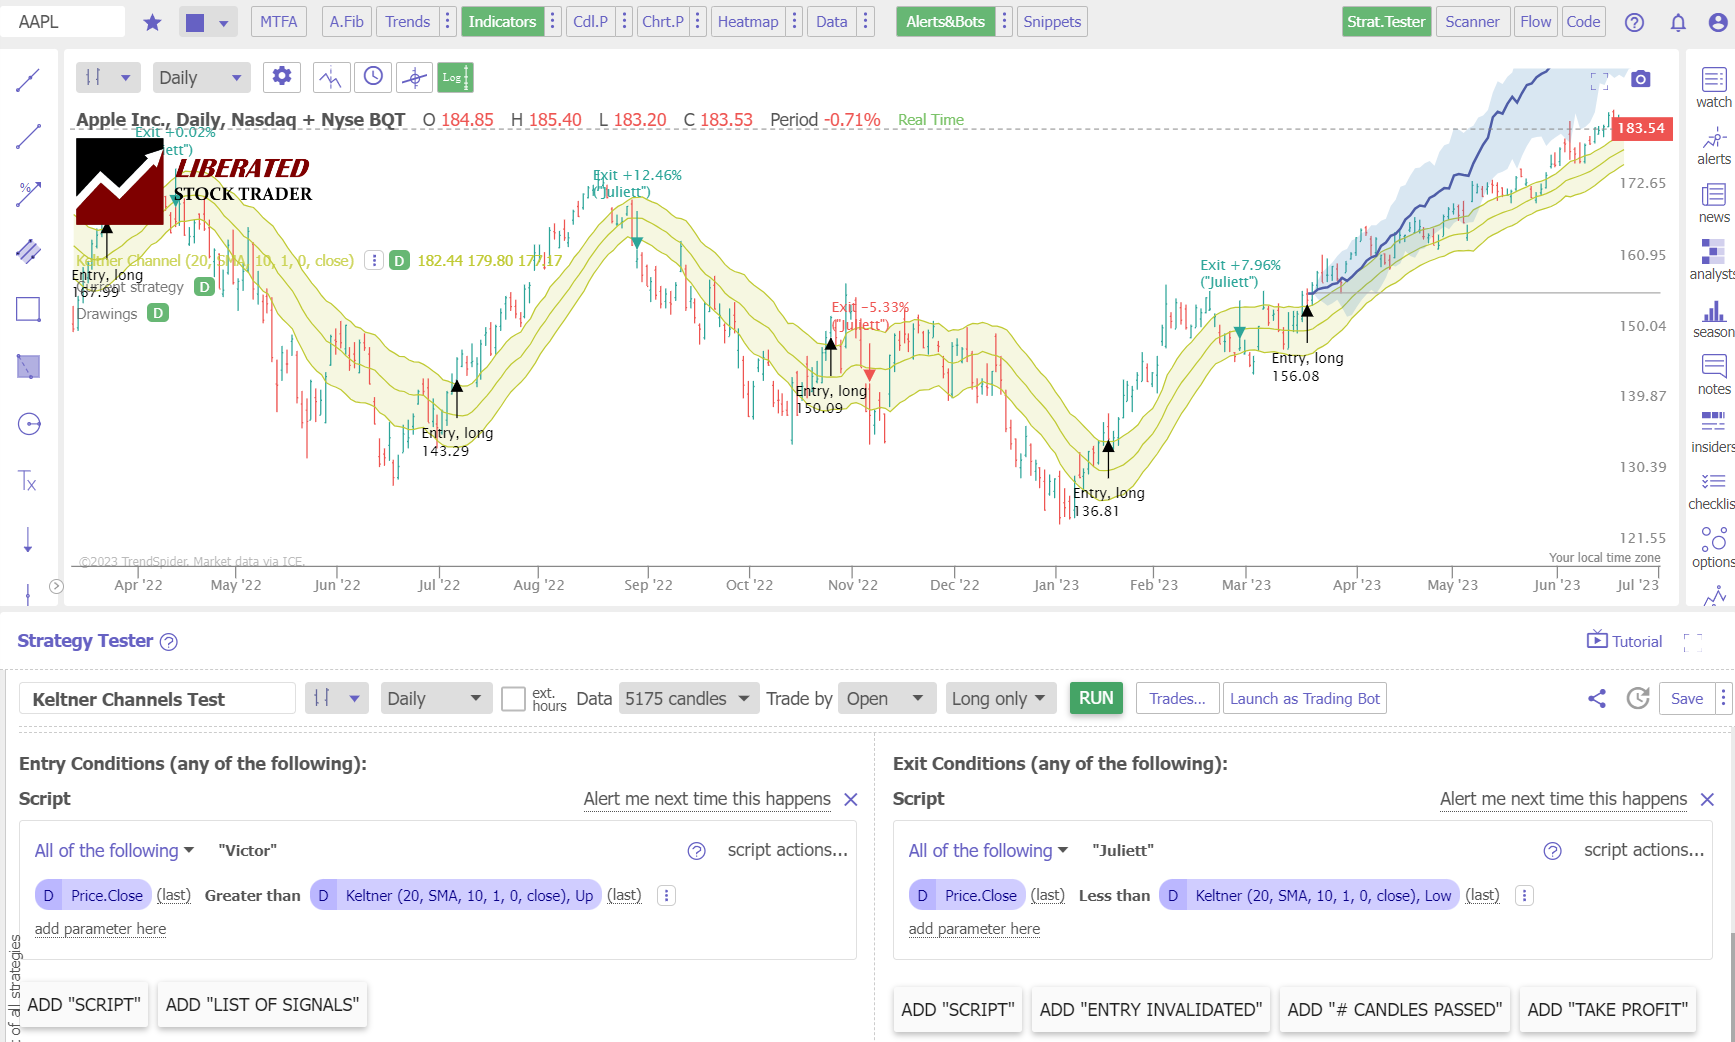
Trading Strategy 1. Buy Oversold & Sell Overbought.
- Register for TrendSpider.
- Buy Signal: Select Strategy Tester > Entry Condition > Add Script > Add Parameter > Condition > Price. Close (Today + 1 Candle Ago) > Less than > Keltner Channels (20 EMA,10,1, Close), Low.
- Sell Signal: Exit Condition > Add Script > Add Parameter > Condition > Price. Close (Today + 1 Candle Ago) > Greater than > Keltner Channels (20 EMA,10,1, Close), Up.
- Finally, click “RUN.”
See the image below for the exact configuration
Backtest Your Strategies on TrendSpider Now
Do you want to test any indicator, chart pattern, or performance for any US stock? The award-winning TrendSpider software makes it easy! Our Trendspider review unveils insights into discovering the most powerful trading strategy development and testing service.
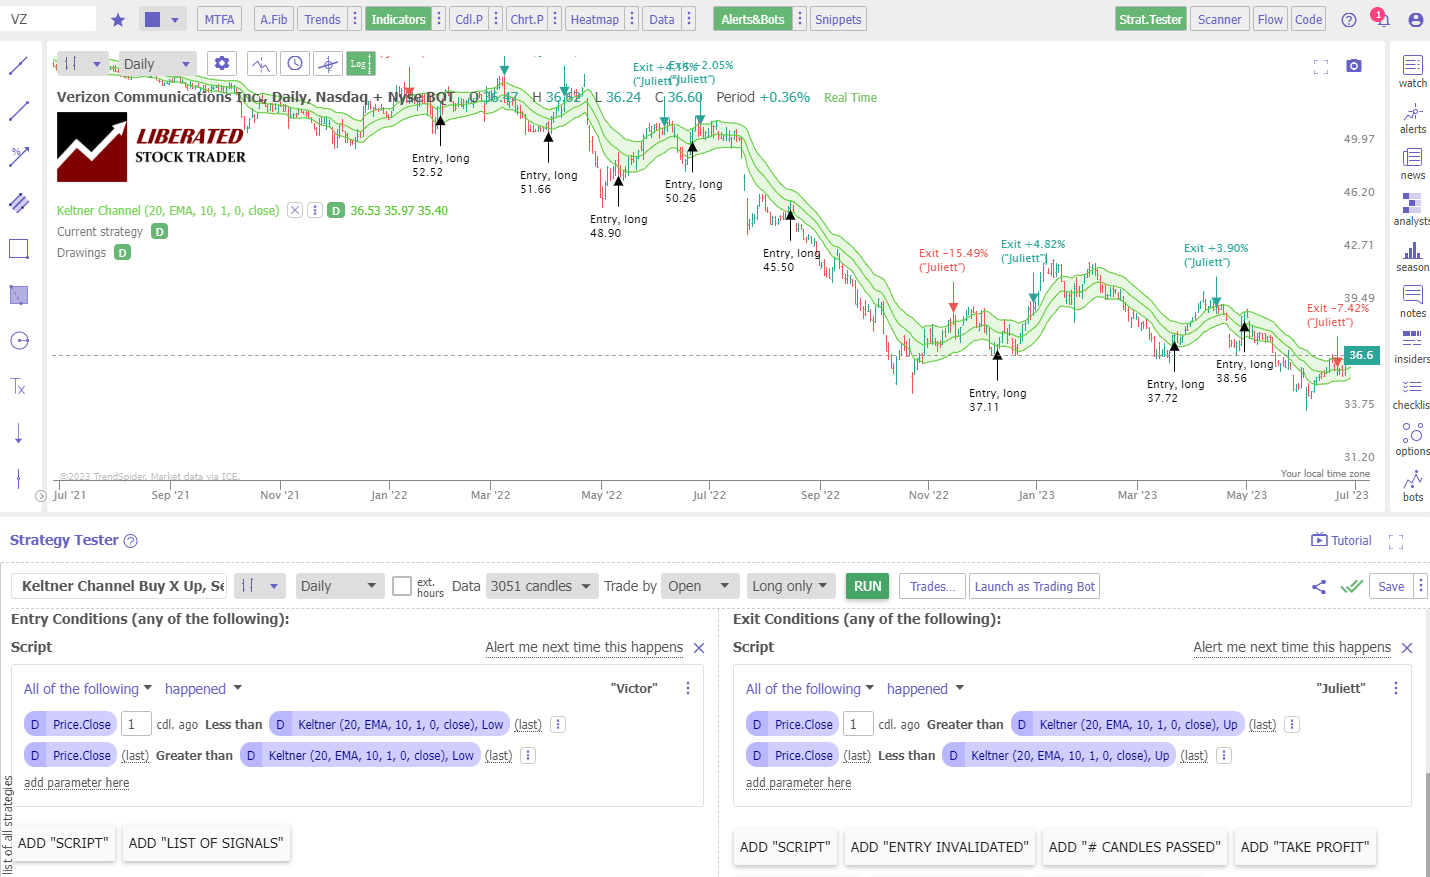
Trading Strategy 2. Buy Overbought & Sell Oversold
- Register for TrendSpider.
- Buy Signal: Select Strategy Tester > Entry Condition > Add Script > Add Parameter > Condition > Price. Close > Greater than > Keltner Channels (20 EMA,10,1, Close), Up.
- Sell Signal: Exit Condition > Add Script > Add Parameter > Condition > Price. Close > Less than > Keltner Channels (20 EMA,10,1, Close), Low.
- Finally, click “RUN.”
See the image below for the exact configuration.
Backtesting Results
The performance results were poor with all Keltner channel settings on the Dow Jones Industrial Average stocks on four timeframes: 1-minute, 5-minute, 1-hour, and daily charts. On a 1-minute chart, Keltner Channels produced a very low success rate of 17%. On an hourly chart over two years, Keltner Channels produced a weak 37% win rate versus a buy-and-hold strategy.
I tested the five different Keltner Channels settings on 1,800 years of data, and all the following configurations performed badly:
- 10, EMA 20,1,0
- 20 EMA 10,1,0
- 20 EMA 10,1.5,0
- 20, SMA 10,1,1
- 20, SMA 10,1,2
Strategy 1 Performance Results.
Strategy 1: Buy Crossing up through Lower Channel, Sell Crossing Down Through Upper Channel
| Keltner Channel Setting | OHLC Chart | Duration | % Winners | Avg # Trades |
| 20 EMA 10,1,0 | 1-min | 20 Days | 30% | 83 |
| 20 EMA 10,1,0 | 5-min | 2 Months | 17% | 64 |
| 20 EMA 10,1,0 | 1-hour | 2 Years | 37% | 63 |
| 20 EMA 10,1,0 | Daily | 12 Years | 30% | 50 |
| Average | 28% | 70 |
The Strategy 1 data suggest that buying when the price crosses up through the lower Keltner Channel and selling when the price crosses down through the lower channel is a losing strategy that should be avoided. On all timeframes across 12 years, the Keltner Channel indicator performs very poorly.
Strategy 2 Performance Results.
Strategy 2: Buy Overbought & Sell Oversold
| Keltner Channel Setting | OHLC Chart | Duration | % Winners | Avg # Trades |
| 20 EMA 10,1,0 | 1-min | 20 Days | 17% | 89 |
| 20 EMA 10,1,0 | 5-min | 3 Months | 33% | 64 |
| 20 EMA 10,1,0 | 1-hour | 2 Years | 10% | 63 |
| 20 EMA 10,1,0 | Daily | 12 Years | 0% | 43 |
| Average | 15% | 72 |
The Strategy 2 data suggests that buying when the price crosses up through the upper Keltner Channel and selling when the price crosses down through the lower channel is also a losing strategy that should be avoided at all costs. On all timeframes across 12 years, the Keltner Channel indicator is weak and produces no winners on a daily chart.
Why are Keltner Channels a Poor Performing Indicator?
Keltner Channels are poor-performing indicators because they lag and react slowly to price movements. As soon as the price forms a new direction, the Keltner Channel indicator is left behind. This lag results in many false signals generated by the indicator, leading to losers more often than winners and a net negative return.
In addition to the lag in responding to new price movements, Keltner Channels tend to be too wide or too narrow, depending on the market’s volatility. When they are too wide, they lead to many false signals as prices move up and down within the channels without actually breaking through them. When they are too narrow, the indicator doesn’t capture enough price action to be useful. This makes it difficult to use Keltner Channels consistently, reducing their usefulness for profitable trades.
The Best Keltner Channels Settings
Our 1800 years of TrendSpider backtests conclusively revealed that the best setting for Keltner Channels is 20 EMA 10,1,0 on a 60-minute chart. This produced a win rate of 37% versus a buy-and-hold strategy. Although this is the best setting, using this indicator is still a losing strategy.
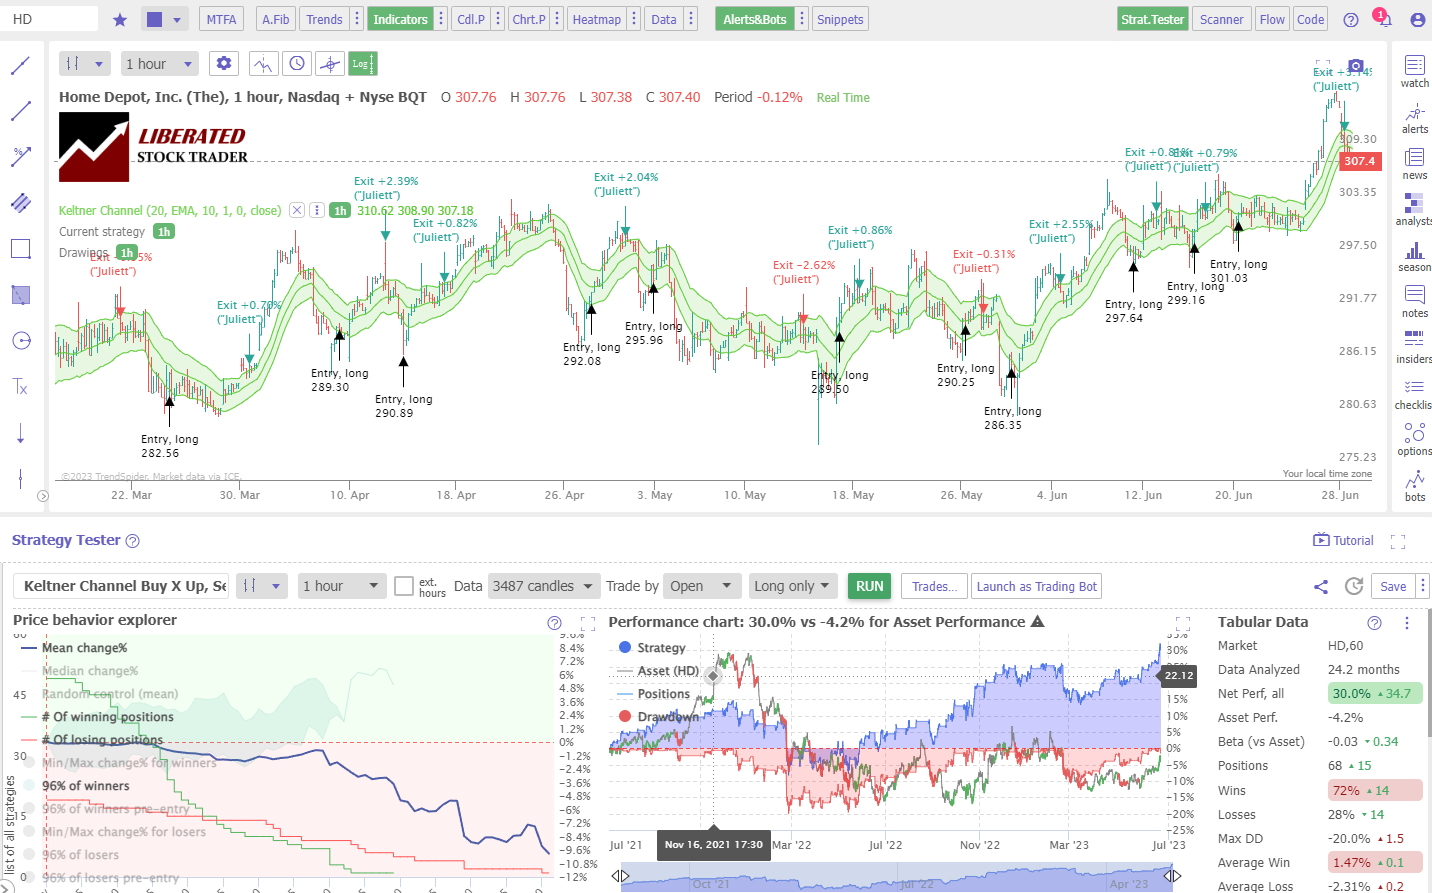
Keltner Channels Test: 60-Minute Chart
Our testing of Home Depot (Ticker: HD) on a 1-hour chart over two years shows a Keltner Channels strategy returning a profit of +30% versus the buy-and-hold return of -4.2%. There were 68 trades with a 72% Win Rate and an average win of 1.47% versus a loss of -2.31%.
An indicator that enables 85% of trades to be winners is rare, which made Keltner Channels profitable on this stock. However, using this strategy, 63% of the Dow Jones 30 returned a loss.
Backtest Powerful Strategies on TrendSpider Now
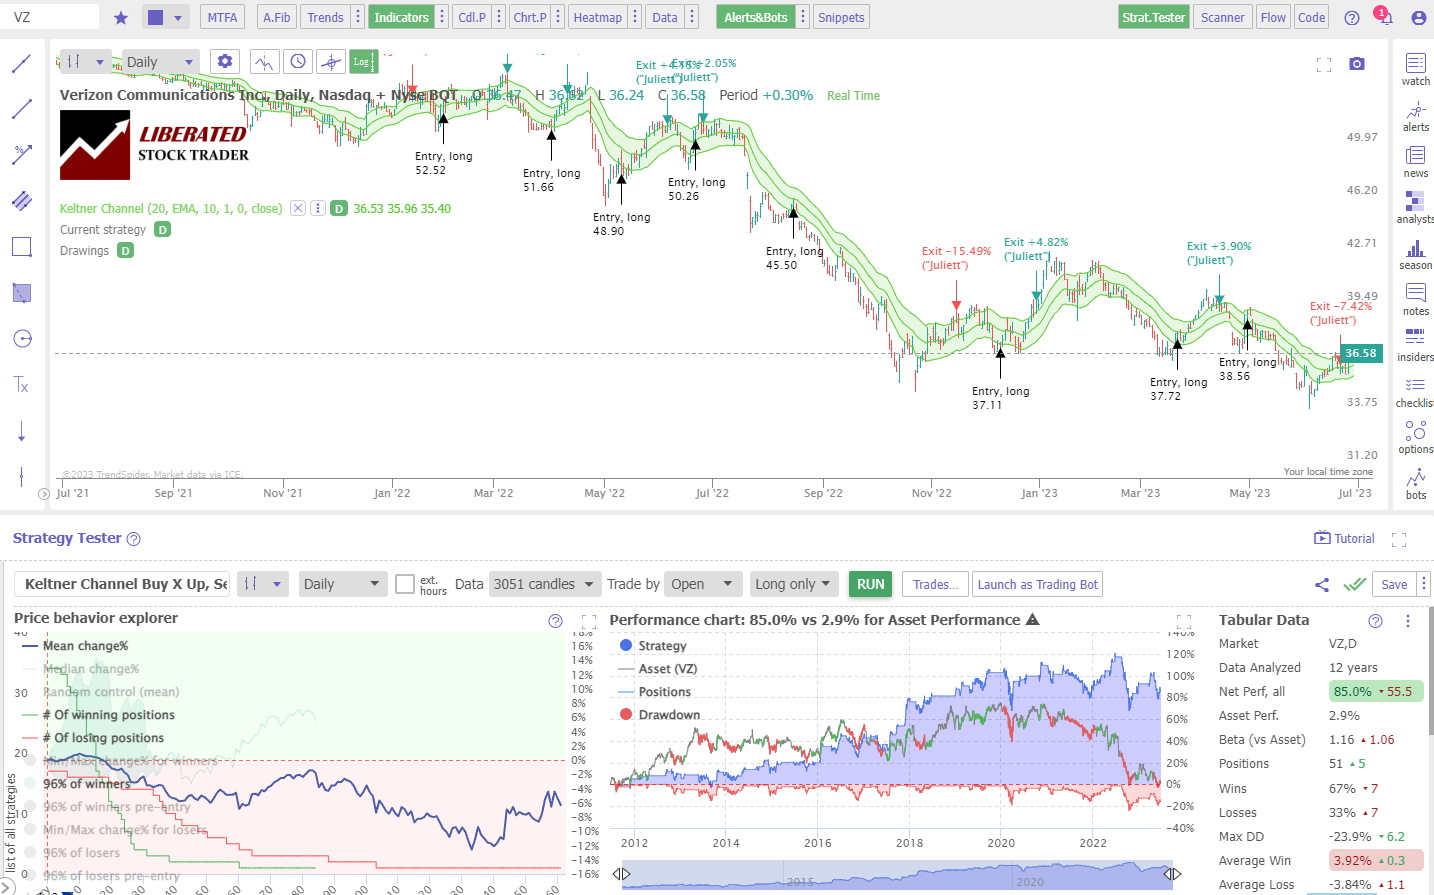
Keltner Channels Test: Daily Chart
The strategy 1 Keltner Channels setting worked well on Verizon, returning 85% over 12 years versus a buy-and-hold return of 2.9%. But again, the strategy failed across the entire DJ-30 Index of stocks with a 30% failure rate, meaning 90% of the stocks traded with Keltner Channels failed to beat the underlying asset’s performance.
Get Point & Click Backtesting on TrendSpider
A Winning Strategy
After weeks of testing, I found a winning Keltner Channel trading strategy. It outperformed the S&P 500 by 211% over 20 years, with 55% of successful trades and a yearly growth rate of 12.73%. The strategy and performance results are explained below.
Combining Keltner Channels with Other Indicators
Keltner Channels can be combined with other technical indicators, such as Price Rate of Change, Money Flow Index, CCI indicator, or Heikin Ashi Charts, for a more profitable trading strategy. Additionally, using bullish chart patterns is a proven profitable strategy.
To test whether combining Keltner Channels with other indicators is profitable, I suggest using TrendSpider, our recommended stock research, and AI-powered trading software.
Can Keltner Channels be used for buy and sell signals?
No, Keltner Channels should not be used for buy-and-sell signals. Our 1800 years of data suggest they should be avoided; they produce too many false signals and are an outdated concept.
Should You Use the Keltner Channels?
No, our testing shows that Keltner Channels are an unreliable indicator, using standard and customized settings on all timeframes, from 1-minute to daily charts. Keltner Channels only have a 72% failure rate across the Dow Jones 30 stocks.
Are Keltner Channels Accurate?
No, overall, Keltner Channels are not accurate using any configuration on any timeframe. The indicator averages a 72% to 85% failure rate across the 30 Dow Jones stocks. Using Keltner Channels to trade stocks is an unprofitable strategy.
Limitations of Keltner Channels
According to our testing, Keltner Channels used in isolation perform poorly, so you should combine them with different chart patterns and indicators. This will help you avoid more false signals and larger losses.
Disclaimer: Trading involves a substantial risk of loss and is unsuitable for all investors. Past performance is not indicative of future results.
Are Keltner Channels Reliable?
No, Keltner Channels are unreliable for buying and selling signals using the standard settings (20,2,2). Our testing shows that Keltner Channels, when used with standard settings on 1 and 5-minute charts, have only a 27% reliability.
Summary
After testing three strategies across 1800 years of data, we confirm Keltner Channels are generally a losing trading strategy. Keltner Channels use simple and exponential moving averages, which we have already proven to be poor chart indicators. Additionally, using Average True Range does not adequately compensate for the loss of predictability. While developing winning strategies based on Keltner Channels may be possible, trading them with standard settings is unprofitable and unreliable.
As always, traders should use caution when entering any trade and remember that past performance does not necessarily indicate future results. Always practice trading in a demo account before risking real money as losses.
I have researched and tested many technical analysis indicators, and many indicators, such as moving averages and Keltner Channels, underperform.
However, traders should not rely solely on Keltner Channels; instead, combine it with additional indicators and conduct their own testing using TrendSpider or FINVIZ Elite.
FAQ
Are Keltner Channels good for trading?
No, our research shows that Keltner Channels is a poor indicator on all timeframes from 1 minute to daily charts. Keltner Channels produced a weak 28% average success rate versus a long-term buy-and-hold strategy. Our 12-year tests of the 30 Dow Jones Industrial Average stocks prove Keltner Channels should be avoided.
What is the best setting for Keltner Channels?
Our testing shows that the best setting for Keltner Channels is 20 EMA 10,1,0 on an OHLC 60-minute chart, yielding a 37% win rate. This means that Keltner Channels lost on 63% of stocks used for trading. So the best setting for Keltner Channels is not to use it.
What indicators are better than Keltner Channels?
Keltner Channels is an unprofitable indicator. However, others have higher success rates, such as Heikin Ashi charts, combined with the Rate of Change, RSI, Money Flow Index, and bullish chart patterns. Our testing has proven these indicators to be more effective, work on many timeframes, and are more successful in trading strategies.
Is Keltner Channels the best indicator?
No, Keltner Channels is a poor indicator for trading, with a 63 percent failure rate; bullish chart patterns such as the double bottom have an 88 percent success rate. I recommend learning to backtest and fine-tune trading strategies with TrendSpider for trading success.
What is the best timeframe for Keltner Channels?
The best timeframe for Keltner Channels is on an hourly chart or daily chart. Hourly charts produce a 37% success rate, and a daily chart produces a 30% success rate with the setting 20 EMA 10,1,0.
How reliable are Keltner Channels?
Keltner Channels is an unreliable technical analysis chart indicator. Our 1800 years of backtested data on 30 major US stocks show only a 30% chance of beating a buy-and-hold strategy across all chart timeframes.
What is the best software for trading and testing Keltner Channels?
When conducting our in-depth Keltner Channels trading analysis, we relied on TrendSpider - an industry-leading trading tool for backtesting and strategy development. I was impressed by its power and simplicity!
Which is better, Bollinger Bands or Keltner Channels?
Bollinger Bands' low average success rate of 33% is still better than the Keltner Channels' performance of 28% on standard OHLC charts based on 10,600 years of backtested exchange data. Our research also indicates that an exponential moving average of 20 on a Heikin Ashi chart outperforms Bollinger Bands with an 83% success rate.
How to read the Keltner Channels chart?
The Keltner Channels chart comprises three lines: two outer channels and a middle line. The outer channels indicate the price range (high to low) over a given period and act as support and resistance levels. The middle line indicates trend direction, which can be used to identify buy/sell signals.
What is the best software for trading Keltner Channel indicators?
TrendSpider is hands-down the top software for trading and backtesting Keltner Channels; with point-and-click backtesting requiring no coding, it's my go-to software! TradingView is also good, offing pine code backtesting and global stock exchange, crypto, and forex coverage.
Is Keltner Channels the same as Bollinger Bands?
No, Bollinger Bands and Keltner Channels are two different indicators. While both use moving averages to measure volatility, Keltner Channels are based on the average true range (ATR) rather than standard deviations from the mean. This makes them respond differently to market swings and short-term price movements!
Do Keltner Channels work?
No, Keltner Channels do not work well according to our testing across four timeframes and five different configurations, producing a 63% to 90% failure rate when used on stocks. We recommend using other indicators such as Rate of Change, RSI, Money Flow Index, and bullish chart patterns.
How accurate are Keltner Channels?
Keltner Channels are inaccurate, especially with a standard OHLC, line, or candlestick chart. Our research indicates that Keltner Channels have the worst accuracy of all technical indicators averaging an 88% failure rate.
Can I make money trading Keltner Channels?
Making money using Keltner Channels is difficult because, according to our research, the indicator is a poor predictor of future asset movements. We recommend using other tools such as Rate of Change, RSI, and Money Flow Index to increase your probability of success. If you decide to use Keltner Channels for your trading decisions, make sure to backtest them with TrendSpider.
Are Keltner Channels effective for day trading?
No, Keltner Channels are not effective for day trading. Our test results on 1-minute charts show a low success rate of 30 percent, and a 5-minute chart had a 17 percent success rate. You can develop, fine-tune and test your unique day trading Keltner Channels strategy by backtesting with TrendSpider.