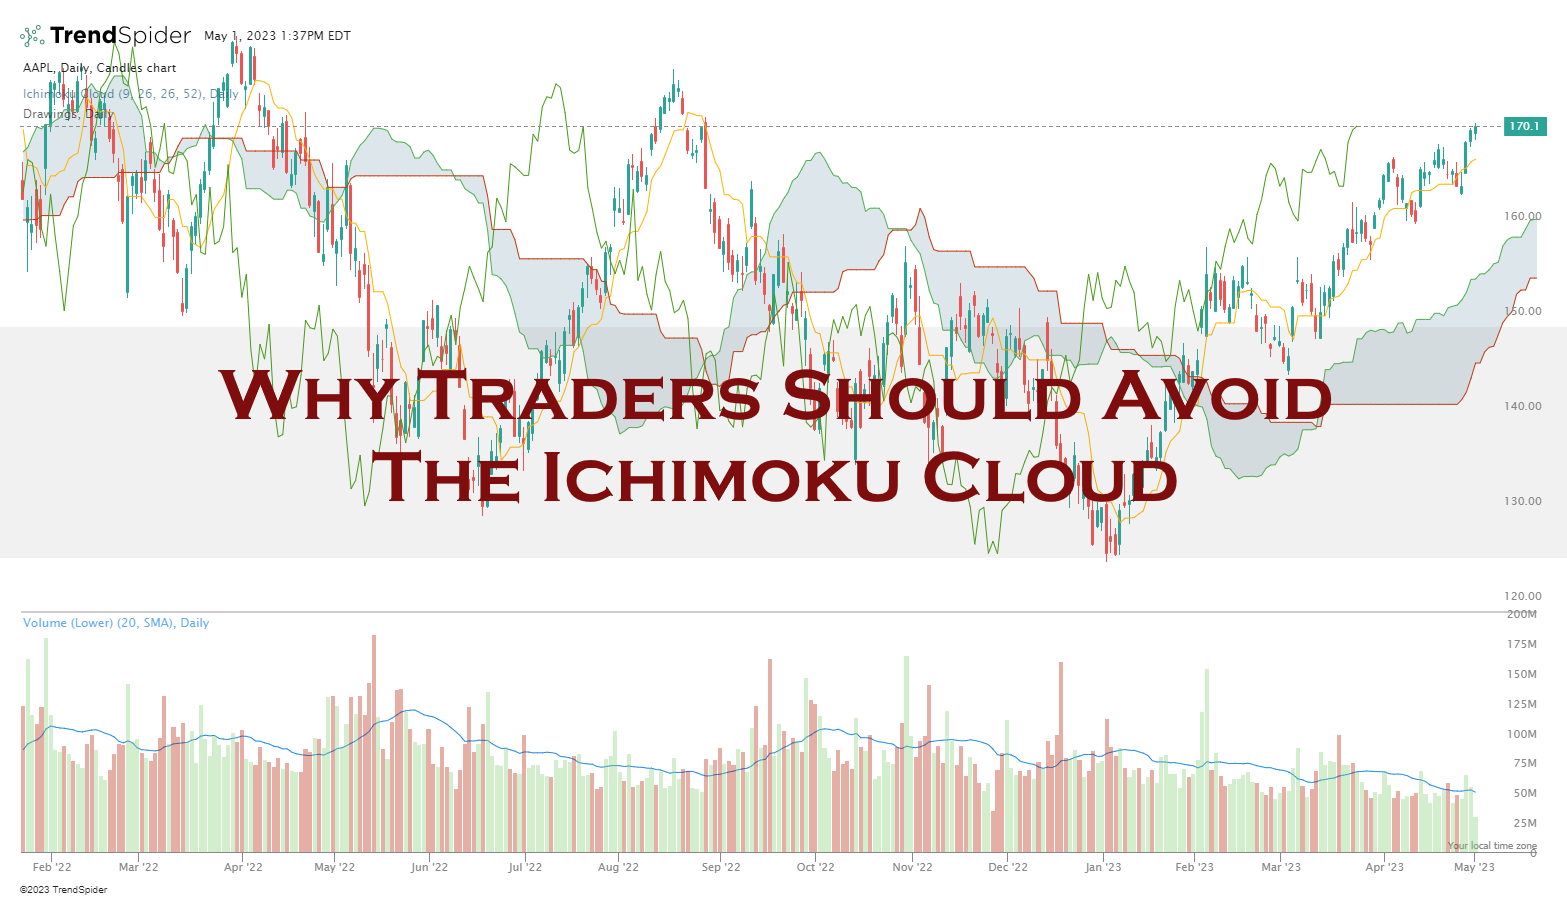
Ichimoku Cloud, or “Ichimoku Kinko Hyo,” is a moving average-based chart indicator that visualizes the market’s direction, momentum, and support/resistance levels.
Using TrendSpider’s advanced backtesting engine, I scientifically tested Ichimoku cloud accuracy, settings, and success rates.
I backtested the Ichimoku Cloud strategy on the DJ-30 Index stocks over 20 years, resulting in 600 years of testing and 15,024 trades.
The Ichimoku test results are a dismal 10% win rate, underperforming a buy-and-hold strategy 90% of the time. The Ichimoku indicator is a poor choice for traders.
Many chart indicators, including Ichimoku, are not profitable. Keep reading to learn everything you need to know about trading the Ichimoku Cloud indicator.
What Is Ichimoku Cloud?
The Ichimoku Cloud, or “Ichimoku Kinko Hyo,” is a popular Japanese technical analysis chart indicator. It is different from other indicators in that it paints clouds onto a chart to visualize price trends, momentum, and pivot points for asset prices.
This visually impressive indicator calculates the equilibrium in a stock price’s demand and supply to help predict future price movement.
The Ichimoku Cloud measures the speed and direction of price movements. Specifically, it compares current prices with those in the recent past. This comparison lets traders determine whether a security is trending, either up or down, and how quickly its price changes.
Goichi Hosoda, a journalist, started work on the indicator in the 1930s and 30 years later released it in his 1969 book. The name Ichimoku comes from his nickname, as his friends called him Ichimoku Sanjin, which in English means “what a man in the mountain sees.”
Understanding the Ichimoku Indicator?
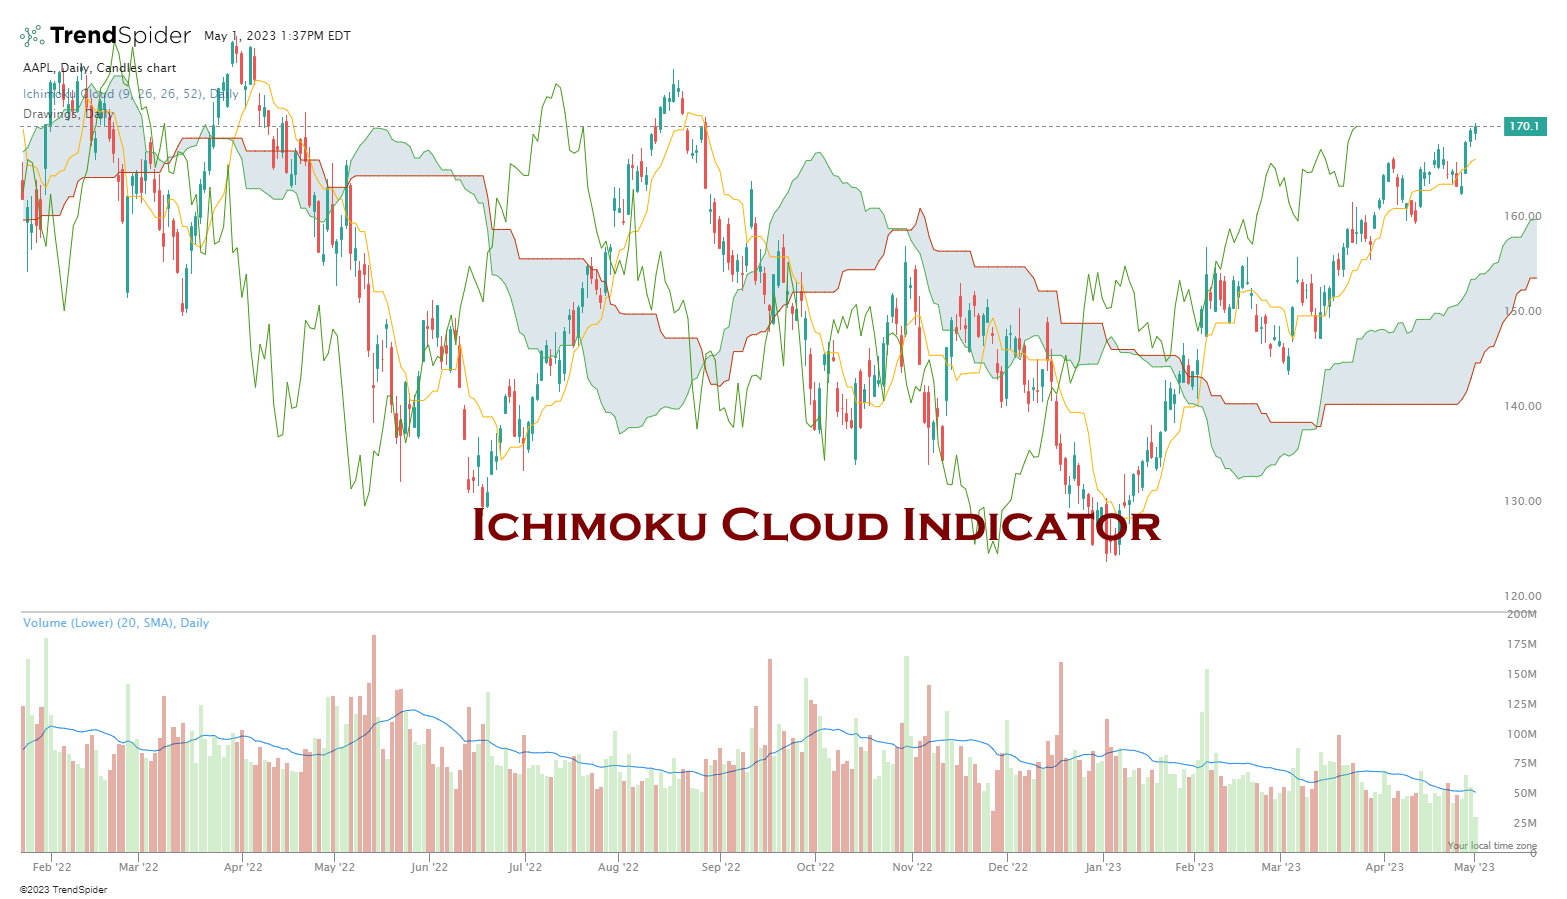
The Ichimoku Cloud indicator comprises five lines, each with its own function.
- The Tenkan-sen line (Turning Line) is a fast-moving average (9) conversion line that marks the average between the highest high and lowest low over a given period.
- The Kijun-sen line (Base Line) is similar to the Tenkan-sen line, but it is a slow-moving average (26) that measures the average of the highest high and lowest low over a longer period.
- The Senkou Span A (Leading Span A) plots the midpoint between the Tenkan-sen and Kijun-sen lines and then projects it 26 periods into the future.
- The Senkou Span B (Leading Span B) plots the midpoint between the highest high and lowest low over the past 52 periods and is then projected 52 periods into the future.
- Finally, the Chikou Span (Lagging Span) plots today’s closing price 26 periods into the past.
Theoretically, the Ichimoku Cloud indicator can assess the overall trend, identify potential support and resistance levels, generate buy and sell signals, and determine appropriate stop-loss levels.
But as you are about to learn, Ichimoku is a poor indicator.
Example: Ichimoku Cloud Chart
Develop Trading Strategies with TrendSpider
How to Trade the Ichimoku Cloud?
There are three rules for trading Ichimoku: buy above the cloud, sell below the cloud, and wait for trend confirmation when in the cloud.
- When the price exits from the Ichimoku cloud upwards, crossing above the cloud, this is a confirmed bullish trend that should be traded long.
- When the price exits the cloud downwards, this is a negative sign, and you should exit the trade, sell short, or buy Put options contracts.
- When the asset price is in the cloud, this is a period of consolidation or sideways movement that reflects indecision.
In detail, to identify buy signals, the Tenkan-sen line should cross above the Kijun-sen line from below, while the Chikou-span line should be above the closing price 26 periods into the past. If these conditions are met, then a long position can be taken.
Similarly, for bearish signals, the Tenkan-sen line should cross below the Kijun-sen line from above, and the Chikou-span should be below the closing price 26 periods into the past. This would suggest that it is time to take a short position.
However, it is important to note that risk management should always be observed when trading with Ichimoku Cloud and other technical indicators. We prove there are many false signals, so traders need to properly manage their risk by setting stop-losses and take
KEY TAKEAWAYS
- Ichimoku is an incredibly unprofitable indicator.
- Ichimuko has a poor success rate of 10% in testing.
- The Ichimoku Cloud is a lagging indicator.
- The Ichimoku Cloud is visually compelling but low on performance.
Is Ichimoku a Lagging Indicator?
Yes, the Ichimoku Cloud is a lagging indicator because it uses past prices to define support and resistance levels. This means that it will not provide traders with early warnings of potential changes in market direction. As such, traders might want to consider using other technical indicators in addition to the Ichimoku Cloud for a better overall view of pricing.
My thorough testing awarded TradingView a stellar 4.8 stars!
With powerful stock chart analysis, pattern recognition, screening, backtesting, and a 20+ million user community, it’s a game-changer for traders.

Whether you're trading in the US or internationally, TradingView is my top pick for its unmatched features and ease of use.
Explore TradingView – Your Gateway to Smarter Trading!
Pros
- It offers an easy visual representation of price action.
- It allows trend traders to identify potential entry and exit points quickly.
- It can recognize momentum shifts in the market, which can help traders make better-informed decisions about when to enter or exit trades.
- Stop losses and take profits can be identified and adjusted based on the signals provided by the cloud.
Cons
- The Ichimoku Cloud loses vs. a buy-and-hold strategy in 90% of stocks traded.
- No indicator is 100% accurate, but Ichimoku is 90% inaccurate.
- Not suitable for trading any assets.
Why is it Popular?
The Ichimoku Cloud Indicator is rapidly gaining popularity due to its clear visual representation of price action. Unfortunately, despite its visual appeal, most traders do not realize that Ichimoku is a very poor indicator, with a weak record in our rigorous backtesting.
Is Ichimoku Accurate?
No, according to our testing, the Ichimoku Cloud is one of the worst-performing indicators; with 30 stocks tested over 20 years, Ichimoku loses 90% of the time. Ichimoku has a higher-than-average reward/risk ratio of 3.1, but it signals losing trades over 60% of the time.
Can Ichimoku be used for Buy and Sell Signals?
No, we do not recommend using Ichimoku for buy and sell signals. Our researched backtesting shows that the Ichimoku Cloud is one of the worst trading signals on daily charts. The rate of change indicator is a much better trading signal with a 66% success rate.
Backtesting the Ichimoku Indicator
To backtest the Ichimoku Cloud (Ichimoku) indicator, I used TrendSpider, the leading AI stock trading software with pattern recognition and a codeless backtesting engine. Testing was configured with a daily chart, and the exit criteria were set to the next trading day HL2 (Price High + Low /2)
| Testing Criteria | Setting |
| Index: | DJIA |
| Date Range | 20 Years/5000 Candles |
| Ichimoku Settings: | 9,26,26,52 |
| Entry Criteria: | Price > Senkou A & Price > Senkou B |
| Exit Criteria: | Price < Senkou A & Price < Senkou B |
| Sell: Next Open | (Price High + Low /2) |
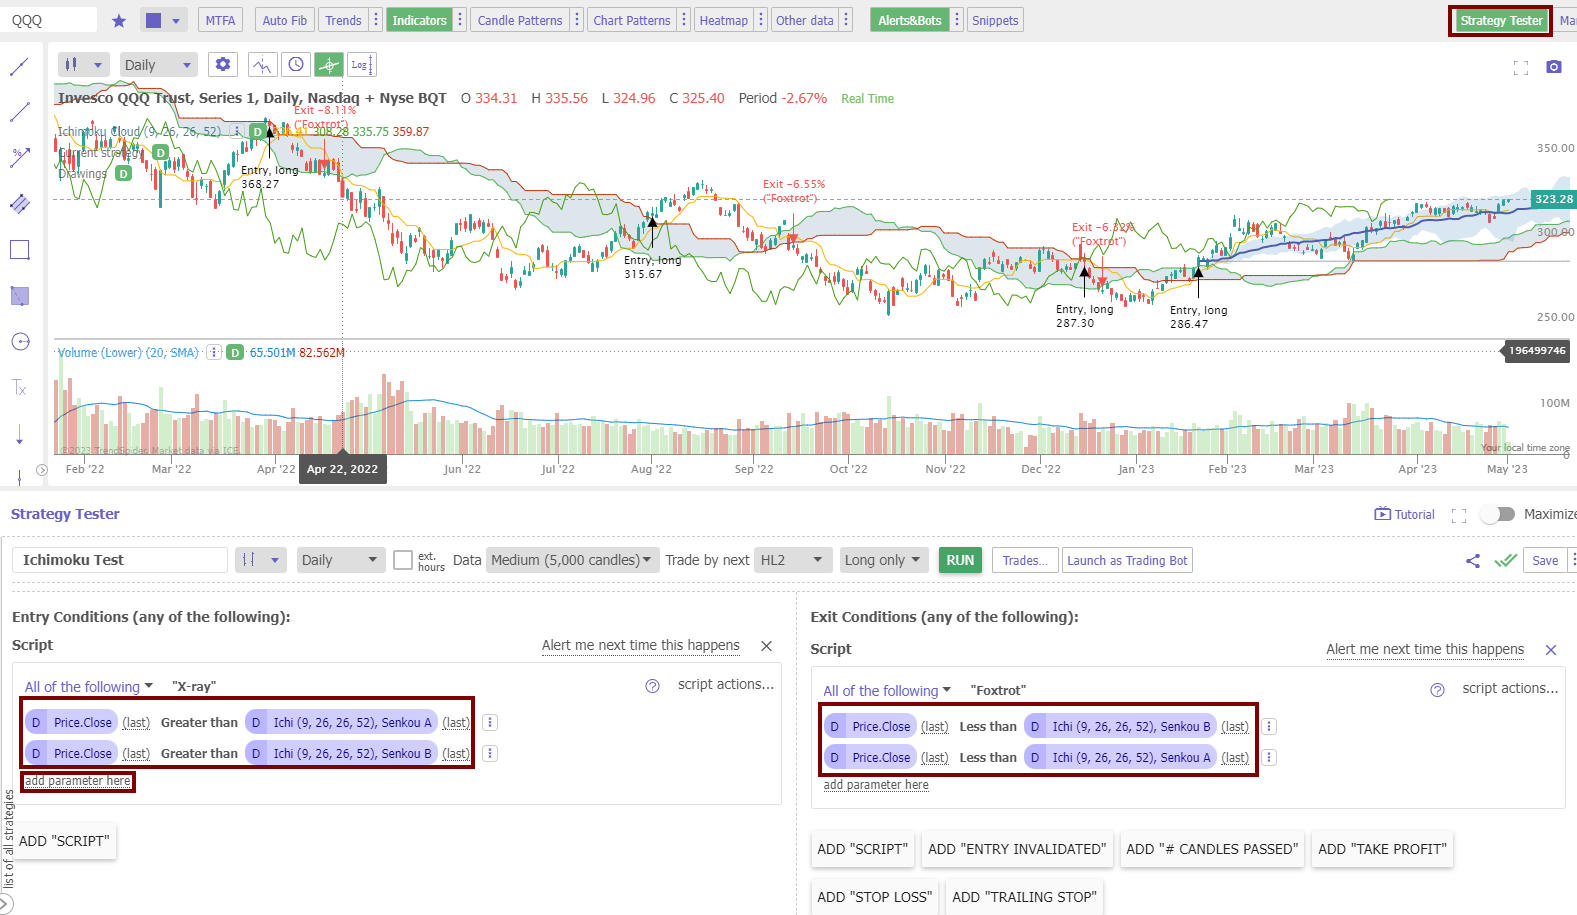
How I Set Up an Ichimoku Backtest
Using the award-winning TrendSpider software, I can easily test any indicator, chart pattern, or chart performance on any US stock. Trenspider offers the most powerful trading strategy development and testing service.
- Visit TrendSpider and sign up for a free trial.
- Select a Ticker – e.g., INTC Intel.
- Click Strategy Tester.
- Click Add Parameter Here > Condition > Price > Greater Than > Indicator-Ichi Senkou A
- Click Add Parameter Here > Condition > Price > Greater Than > Indicator-Ichi Senkou B
- In the Right Hand Box, Select Add Script > Add Parameter Here > Condition > Price > Less Than > Indicator-Ichi Senkou A
- Click Add Parameter Here > Condition > Price > Less Than > Indicator-Ichi Senkou B.
- Select 5000 Candles.
- Select RUN to launch the test.
Chart: Setting up an Ichimoku Backtest
The chart below shows how to set up a rigorous Ichimoku backtest using TrendSpider.
Testing Performed With TrendSpider – The Best Software for Traders
Ichimoku Performance Results vs. Nasdaq 100
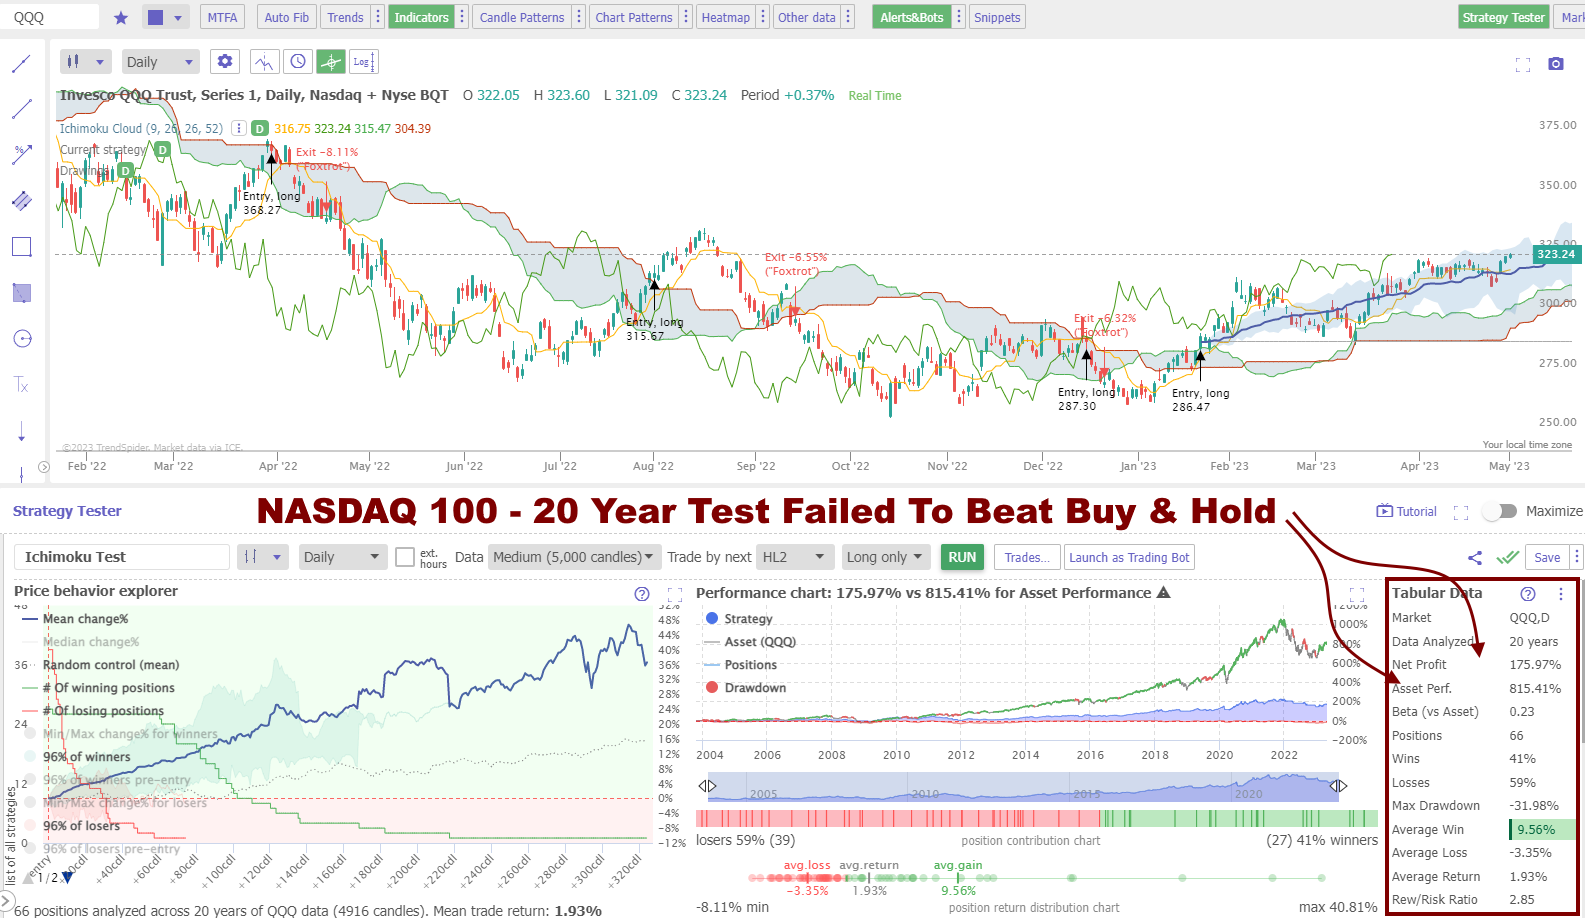
Over the previous 20 years, the Nasdaq 100 has returned 815% with a buy-and-hold strategy. If you had used an Ichimoku Cloud to trade, you would have only made 175%. This proves the Ichimoku Cloud is a poor choice for traders or investors.
Testing Performed With TrendSpider – The Best Software for Traders
In the chart above, you can see the 20-year performance results for the Nasdaq 100 index. Each buy and sell signal is plotted, and on the bottom right of the chart, you can see the detailed performance ratios.
| 20-Year Nasdaq 100 Inchimoku Test | Results |
| Ticker: | QQQ |
| Reward/Risk Ratio: | 2.85 |
| Buy & Hold Performance: | 815% |
| Ichimoku Performance: | 175% |
| # Trades: | 66 |
| Average Win: | 9.56% |
| Average Loss: | -3.35% |
This testing was only possible using TrendSpider, the best backtesting system.
Ichimoku Performance Results vs. S&P 500
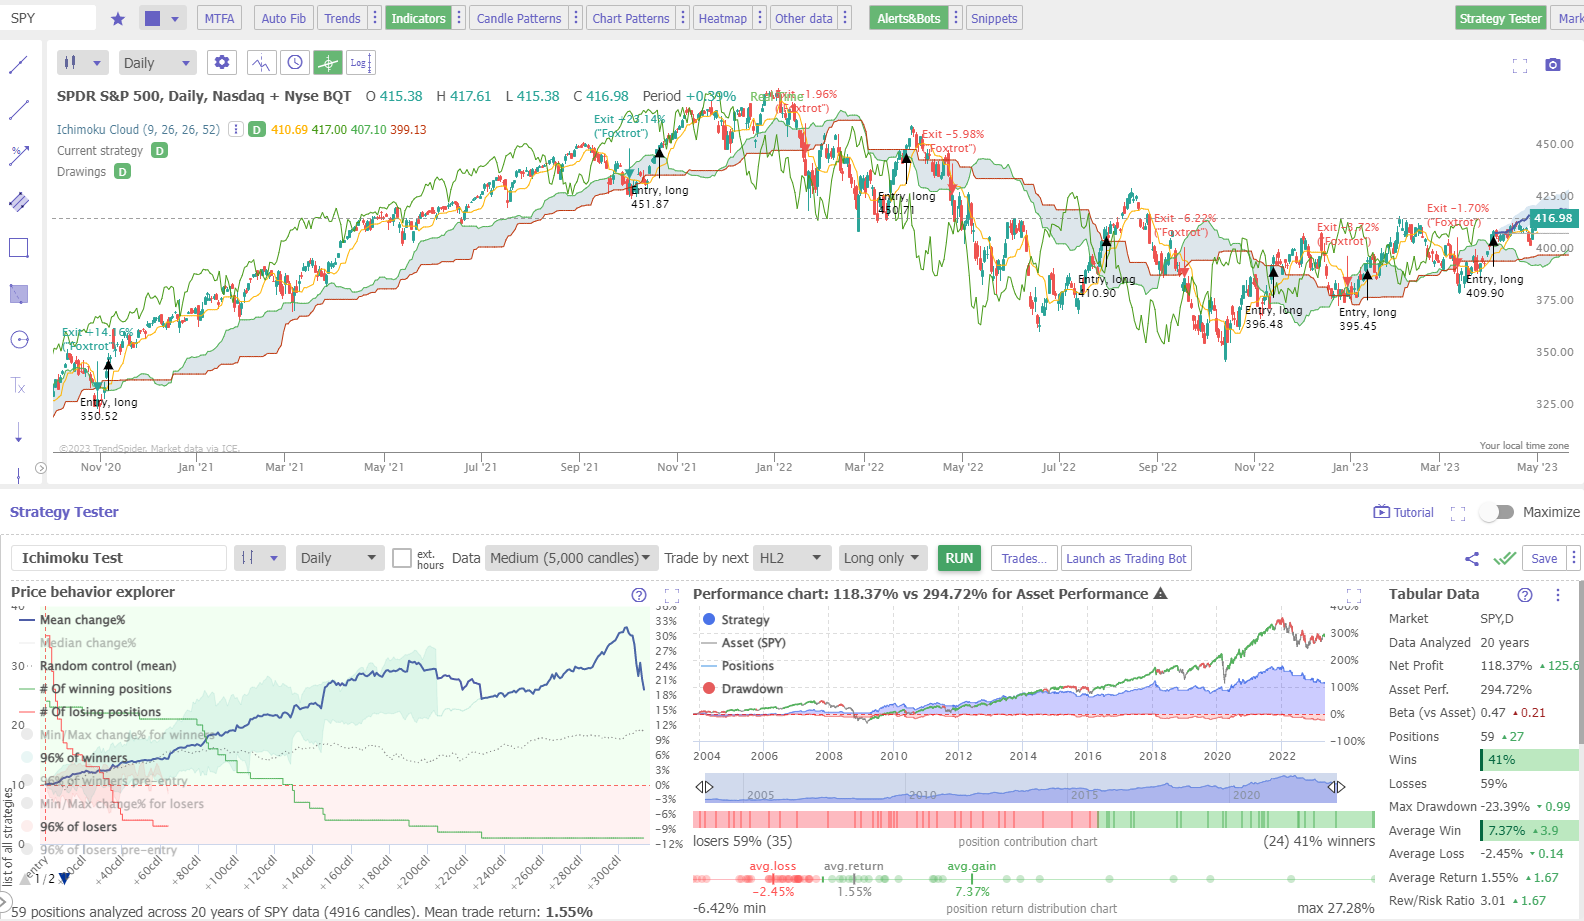
Over 20 years, the Nasdaq 100 has returned 294% with a buy-and-hold strategy. If you had used an Ichimoku Cloud to trade, you would have only made 118%. This again shows the Ichimoku Cloud is an extremely weak indicator.
Develop Powerful Trading Strategies with TrendSpider
In the chart above, you can see the 20-year performance results for the S&P 500 index. Each buy and sell signal is plotted, and on the bottom right of the chart, you can see the detailed performance ratios.
| 20-Year S&P500 Inchimoku Test | Results |
| Ticker: | SPY |
| Reward/Risk Ratio: | 3.01 |
| Buy & Hold Performance: | 294% |
| Ichimoku Performance: | 118% |
| # Trades: | 59 |
| Average Win: | 7.37% |
| Average Loss: | -3.01% |
I tried many solutions, but this testing was only possible using TrendSpider.
Ichimoku Indicator Backtesting Results
Overall, the Ichimoku Cloud indicator was a poor performer, outperforming 10% of the Dow Jones 30 Index by small margins over the last 20 years. Over a 20-year backtest, Ichimoku lost to a buy-and-hold strategy on 90% of the stocks.
The table below shows the best and worst-performing stocks in terms of the risk-reward ratio.
| 20 Year Backtest Results | Best Performer | Worst Performer |
| Ticker: | GS | INTC |
| Reward/Risk Ratio: | 3.79 | 2.09 |
| Buy & Hold Performance: | 290% | -0.9% |
| Ichimoku Performance: | 594% | -54% |
| # Trades: | 61 | 66 |
| Average Win: | 4.43% | 10% |
| Average Loss: | -3.95% | 5% |
The most interesting Ichimoku trade was in IBM, with the buy-and-hold trade over 12 years yielding a net loss of 22.53%, yet using this Ichimoku system, it made a profit of 76%.
Ichimoku Strategy
The Ichimoku trading strategy is one of the worst indicators in technical analysis. I have proven that it does not work on major indices like the S&P500 and the NASDAQ 100 and performs extremely poorly on the Dow Jones 30 stocks.
What is the Best Ichimoku Charting Software?
- TrendSpider: Best Trading Strategy Development and Backtesting Software.
- TradingView: Best for Free Ichimoku Cloud Charting & Huge Social Trading Community.
- MetaStock: Good for Powerful Backtesting & Technical Ichimoku Analysis.
- Related Article: Top 10 Best Stock Market Trading & Analysis Software
Combining Ichimoku with Other Indicators
This indicator can be combined with other technical indicators to form a complete trading strategy. For example, using MACD, Moving Averages, Heikin Ashi charts, Price Rate of Change, Aroon, or even bullish chart patterns.
To test whether combining Ichimoku with other indicators is profitable, I suggest using TrendSpider, our recommended stock research, and AI-powered trading software.
Summary
The Ichimoku Cloud is the worst indicator for traders, with a proven failure rate of 90%. This article proves traders should always perform backtesting and strategy analysis before trading any asset. Most trading websites do not perform in-depth research; they have intern writers who parrot the same story.
Perform your own independent research using TrendSpider, the best software for strategy development and technical analysis. Read the TrendSpider review.
FAQ
What is the best software for Ichimoku Charts?
Our detailed testing of chart indicators has been performed with TrendSpider, which I believe is the best trading software for backtesting and strategy development.
How to read Ichimoku Cloud?
A series of moving averages form a cloud on the chart. To read the Ichimoku Cloud, look for price exiting the cloud upwards; this is a buy signal. When the price exits the cloud downwards, it is a sell signal.
How does Ichimoku Cloud work?
Ichimoku Cloud works using five moving averages to display a cloud pattern on a chart. Theoretically, when price passes up through the cloud, the trend should be bullish. Like an airplane passing through the cloud downwards, the trend is bearish.
Does Ichimoku Cloud work?
No, Ichimoku clouds do not work according to our mathematical backtests. Researching 30 major US stocks for 20 years, for a combined 600 years of testing, we demonstrate that Ichimoku has only a 10% success rate. Ichimoku is one of the worst indicators we have ever tested.
How to interpret Ichimoku Cloud?
Interpreting the Ichimoku cloud is simple. The indicator forms a cloud on the chart, and if the price passes up through the cloud, it is bullish. If the price declines through the cloud, it is bearish.
What is the Ichimoku trading strategy?
The Ichimoku trading strategy involves buying an asset when it emerges up through the cloud and selling when it declines through the cloud. These strategy parameters can be tweaked for better performance, but our tests show that Ichimoku is a badly performing strategy.
How accurate is Ichimoku?
The Ichimoku cloud is not accurate. In fact, our research shows that Ichimoku has a loss rate of 90%, which means it is one of the most inaccurate chart patterns in technical analysis. Ichimoku is marketed as a good strategy when in fact, it is snake oil that should be avoided.
How to make money trading the Ichimoku system?
Our research demonstrates you cannot make money from trading an Ichimoku system. With a success rate of 10% and an average of 60% losing trades, it is close to impossible to make money using Ichimoku.
How to use Ichimoku Cloud with Crypto or Forex?
You can use Ichimoku Cloud with cryptocurrency or Forex trading, but our tests show the results are poor, with only a 10% success rate, and 60% of trades are losers. Whether you choose stocks, crypto, or forex for trading, you must avoid the Ichimoku strategy.
Is Ichimoku a good indicator?
No, our research shows that Ichimoku is not a good indicator, and you should avoid it when trading. It has a low success rate of 10%, with an average of 60% of losing trades, making it close to impossible for traders to make money using the Ichimoku system.
What are better indicators than Ichimoku?
There are many better indicators than Ichimoku, such as CCI and Rate of Change. Our testing has proven these indicators to be much more successful in trading strategies.
Is Ichimoku the best indicator?
No, Ichimoku is not the best indicator; in fact, it is one of the worst indicators in technical analysis. It has a low success rate and an average of 60% losing trades, making it very difficult for traders to make money using the Ichimoku system. If you want to be successful in trading, learn how to backtest trading strategies.
What is the best time frame for Ichimoku?
The best timeframe for an Ichimoku strategy is never. We conducted time-based research and found that the Ichimoku system underperformed the market on all timeframes from 5 minutes to daily charts.
How reliable is Ichimoku Cloud?
The Ichimoku Cloud is an incredibly unreliable chart indicator. Our 20 years of backtests on 30 major US stocks show a 10% chance of beating a buy-and-hold strategy. Testing confirms it is an unreliable indicator and should be avoided.
What is the best software for trading Ichimoku?
Our rigorous analysis of Ichimoku trading was executed utilizing TrendSpider, a leading trading software for backtesting and strategy development, in my professional opinion.

Thanks Barry for your quick reply.
AC
Thanks for the post Barry, very informative post.
However i have a few basic questions (very new to investing, actually still in learning phase, so please bare with my questions as they are very basic-
1. I am assuming ‘Ichimoku Cloud’ is an indicator? just like RSI that we can add to charts.. ?
2. It is recommended to be used for daily charts, correct?
3. Same questions i had pertaining to your post on AD Line- i suppose it is an indicator that can be added from charting tools..?
4. Is there any specif parameter for these two indicators (AD Line & Ichimoku Cloud) before importing them to the charts? or it is standard?
Thanks again for your help.
AC
Hi again Arunav, let me answer your questions.
1. Yes
2. Yes daily is a good timeframe
3. Yes
4. As with all indicators start with the standard timeframes, but then you can tweak the parameters to see which works best for you based. On your trading timelines.
Good luck with your learning, you are on the right path.
Thanks for the informative post!
I found your blog when I was searching on bing, and it brought me right to what I was looking for. I’m going to add your rss feed to my Google Reader, I look forward to reading more of your thoughts
Its Friday and I need more information about macd. Your post open a lot of different ideas in my mind. Good job. Regrads.
Very interesting blog post I enjoy your site carry on the amazing posts
Nice one, I'll check it out.