Price action trading is a method of day trading that relies on technical analysis but ignores conventional fundamental indicators, focusing instead on the movement of prices.
Traders who use this strategy believe that all market information and future price movements are contained within the price data, negating the need for external factors such as news events or economic analysis. This technique requires a deep understanding of how prices move and how different patterns on the chart can signify potential market movements.

Central to price action trading is analyzing historical price movements to identify trends and potential trading opportunities. This approach often involves the study of candlestick patterns and chart formations, allowing traders to recognize the sentiments in the market. Above all, traders need to master identifying key support and resistance levels that act as barriers within the markets, influencing the price movements and providing significant areas to consider for entering or exiting trades.
Key Takeaways
- Price action trading focuses on the raw price data on charts to make trading decisions.
- Recognizing candlestick patterns and understanding support and resistance is crucial.
- Mastery of chart analysis without indicators is central to successful price action trading strategies.
Understanding Price Action Trading
Price action trading is a method that allows you to anticipate market direction based solely on historical prices. This technique discards the need for indicators, focusing instead on price movements.
Definition of Price Action
Price action is the movement of a security’s price plotted over time. As a trader, you analyze these price movements to make informed decisions. Price action trading involves:
- Carefully observing and interpreting candlestick patterns, trends, and price bars.
- Making trading decisions based on an asset’s price history without relying on external indicators or complex formulas.
The chart below displays the key components typically used in price action analysis:
| Component | Description |
|---|---|
| Candlestick Patterns | Visual patterns that indicate potential price moves |
| Support/Resistance | Levels where price historically stops and reverses |
| Trend Analysis | Identifying the directionality of the market |
| Volume | Assessing the strength of a price move |
History and Philosophy
The history of price action trading finds its roots in the early days of the stock market. Pioneers like Richard Wyckoff and Charles Dow developed theories that led to the creation of what today is known as price action trading. They believed that historical prices contained all the necessary information to make trading decisions, an idea central to this approach.
The philosophy embraces the simplicity of working directly with charts and bars to understand the market narrative. As a trader, you focus on what the price tells you, ignoring the noise that can come with economic reports and news headlines. It propels the fundamental principle that price reflects all available information, aligning with the efficient market hypothesis.
The Basics of Market Analysis
When you engage in market analysis, you dissect the various forces influencing asset prices. This is crucial for making informed trading decisions.
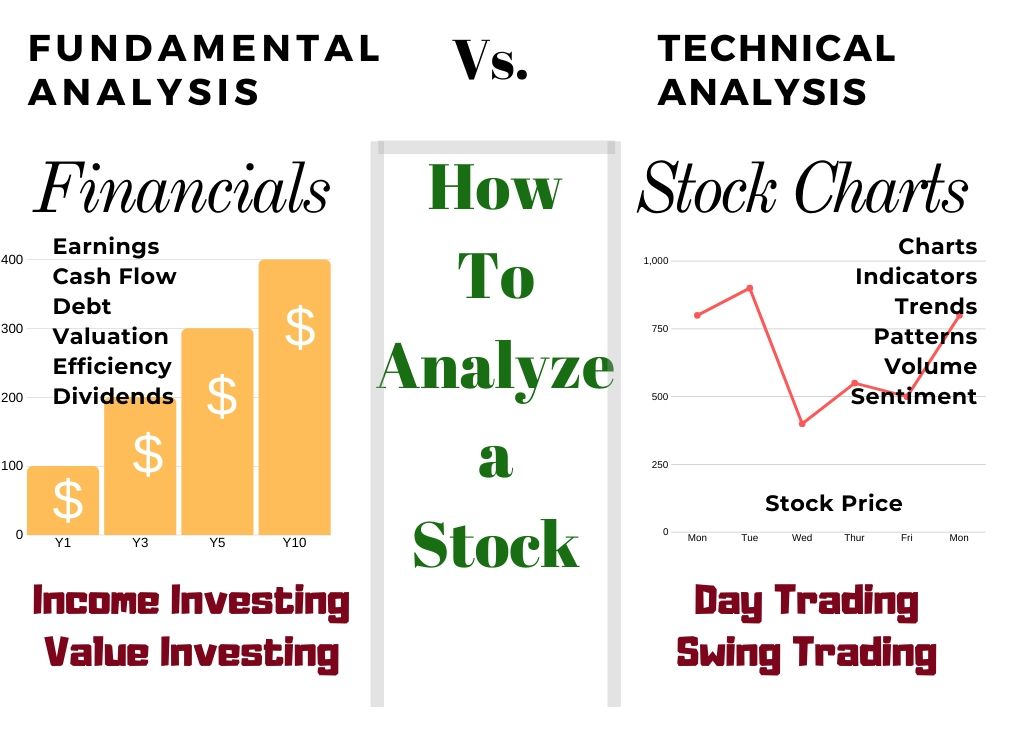
Technical Analysis versus Fundamental Analysis
Technical analysis studies past market data, primarily through charts, to forecast future price movements. As a trader, you rely on patterns and technical indicators like moving averages and relative strength index (RSI) to gauge buyer and seller momentum. For instance:
- Moving Averages: A simple moving average (SMA) calculates the average price over a specified number of periods, smoothing out price action to identify trends.
- RSI: It measures the magnitude of recent price changes to evaluate overbought or oversold conditions.
On the other hand, fundamental analysis involves examining economic indicators, industry conditions, and financial statements to assess a company’s value. Key factors include:
- Earnings
- Economic reports
- Industry trends
- Management quality
| Technical Analysis | Fundamental Analysis |
|---|---|
| Chart Patterns | Earnings |
| Technical Indicators | Economic Reports |
| Price History | Industry Trends |
| Trading Volume | Management Quality |
Importance of Price Movements
Price movements are the lifeblood of your trading strategy in price action trading. Observing how prices have moved in the past can provide context for current market behavior. It’s essential to recognize that:
- Upward price movements suggest bullish sentiment.
- Downward price movements indicate bearish sentiment.
Analyzing price movements helps you understand the strength of an asset’s trend and anticipate potential reversals or continuations in the market.
Charting the Markets
Understanding price charts and their patterns is essential for making informed decisions in price action trading.
Types of Price Charts
There are several key charts you’ll encounter. Candlestick charts offer detailed information about price movements within specific time frames, illustrating the opening, high, low, and closing prices. Bar charts provide similar data but in a simpler format using vertical lines and horizontal notches. Lastly, the line chart connects closing prices over a period of time, offering a clear view of price trends at a glance.
- Open price: bottom of the body (if green) or top (if red)
- Close price: top of the body (if green) or bottom (if red)
- High price: top of the wick
- Low price: bottom of the wick
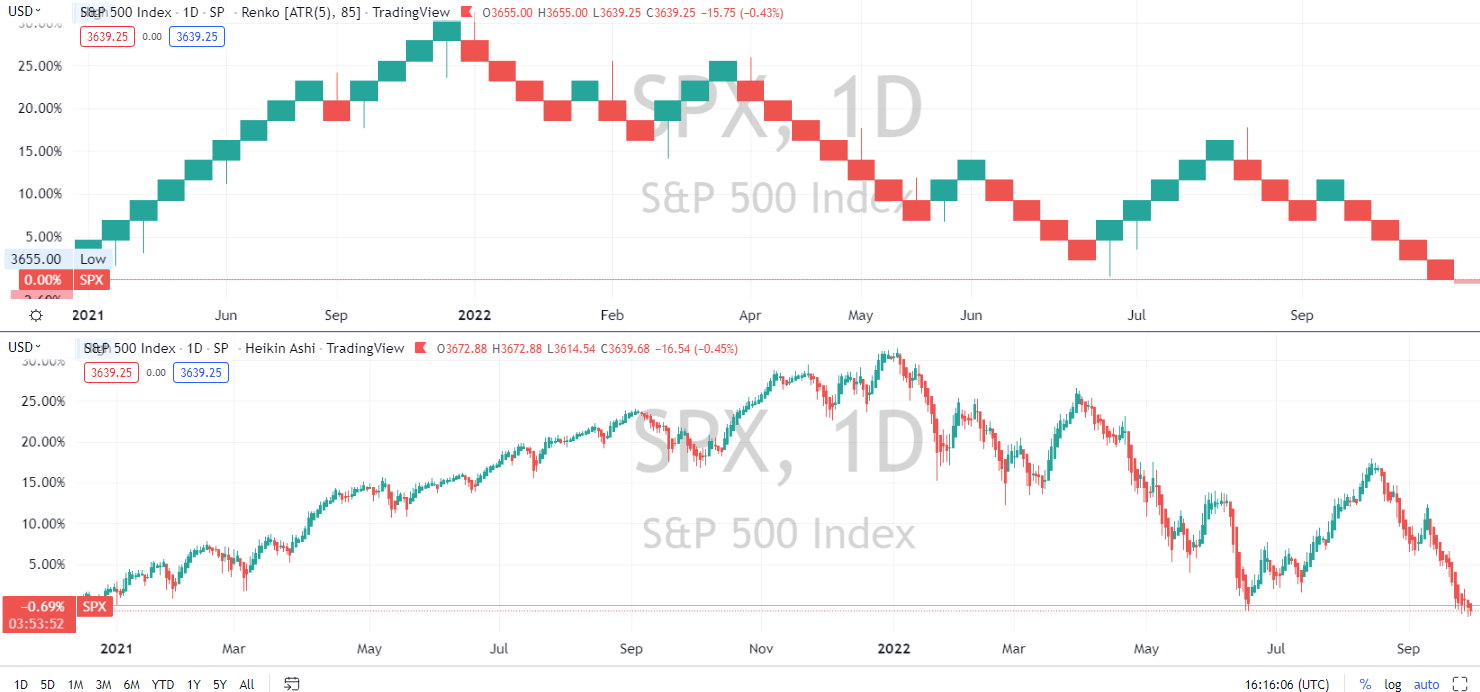
Heikin Ashi charts are designed to filter out volatility and noise in the markets, providing a clearer view of trends. They use modified opening and closing prices and average prices for the period. This smoothens price movements, eliminating unnecessary spikes while keeping most of the original data intact. Heikin Ashi charts are great tools for swing traders looking for quick entry and exit points with limited risk.
Get Powerful Free Charting with TradingView
Renko charts provide a unique way to view market action. Rather than using time periods like bar or candlestick charts, they use bricks that indicate price movements over a specified interval. The Renko chart emphasizes long-term trend direction since all short-term fluctuations are filtered out. These charts are ideal for traders who prefer a more strategic approach and focus on overall trends instead of day trading.
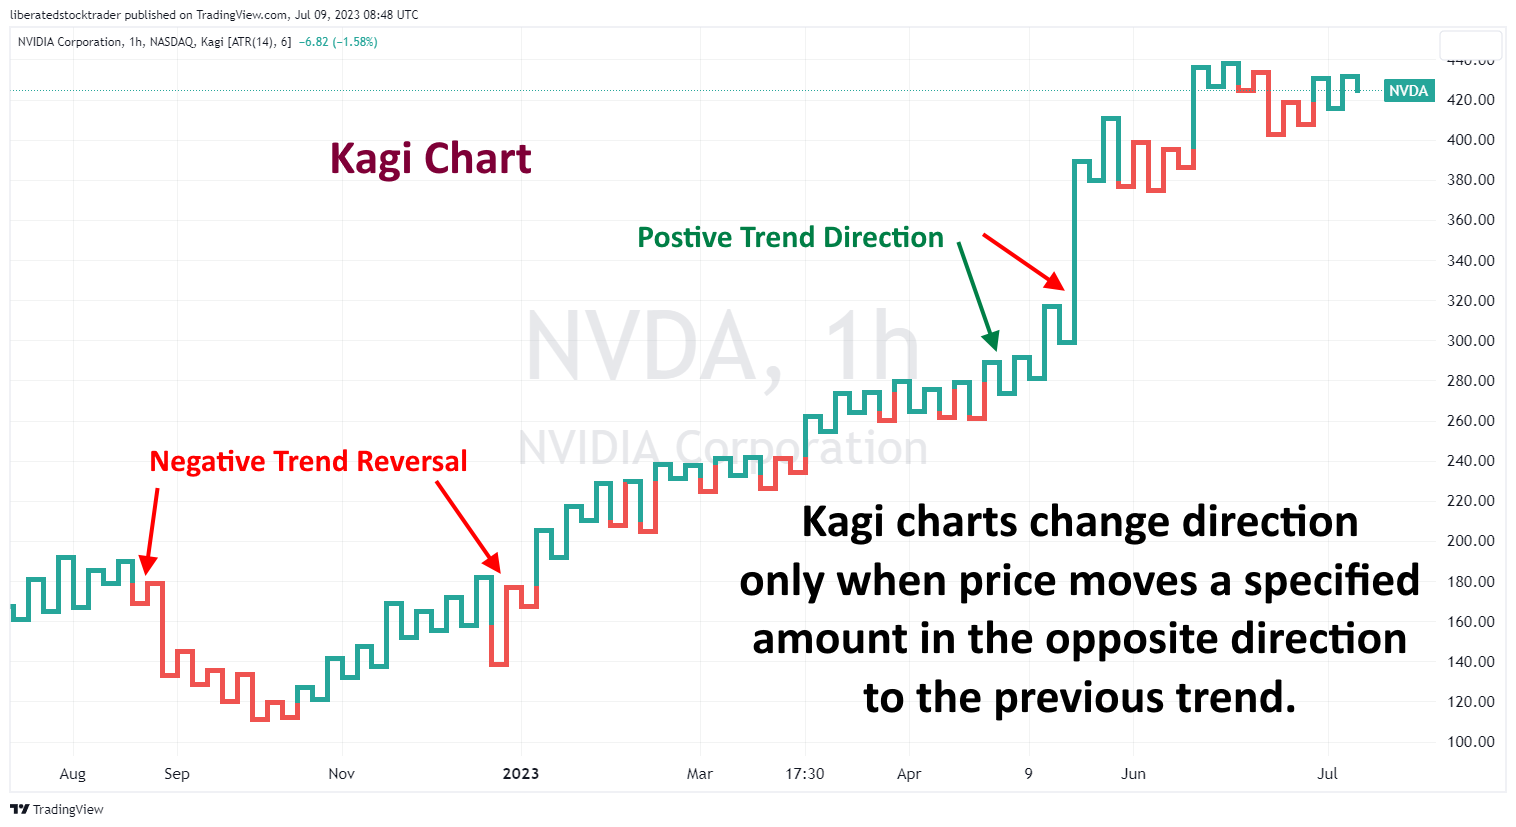
Kagi Charts:
Kagi charts provide insight into price movements like no other chart type by plotting reversals in the trend rather than the current prices. The thickness of each line is determined by the magnitude of the reversal, making these charts great for identifying breakouts and support/resistance levels. Kagi charts can identify turning points in both short-term and long-term trends, making them popular among both day traders and swing traders.
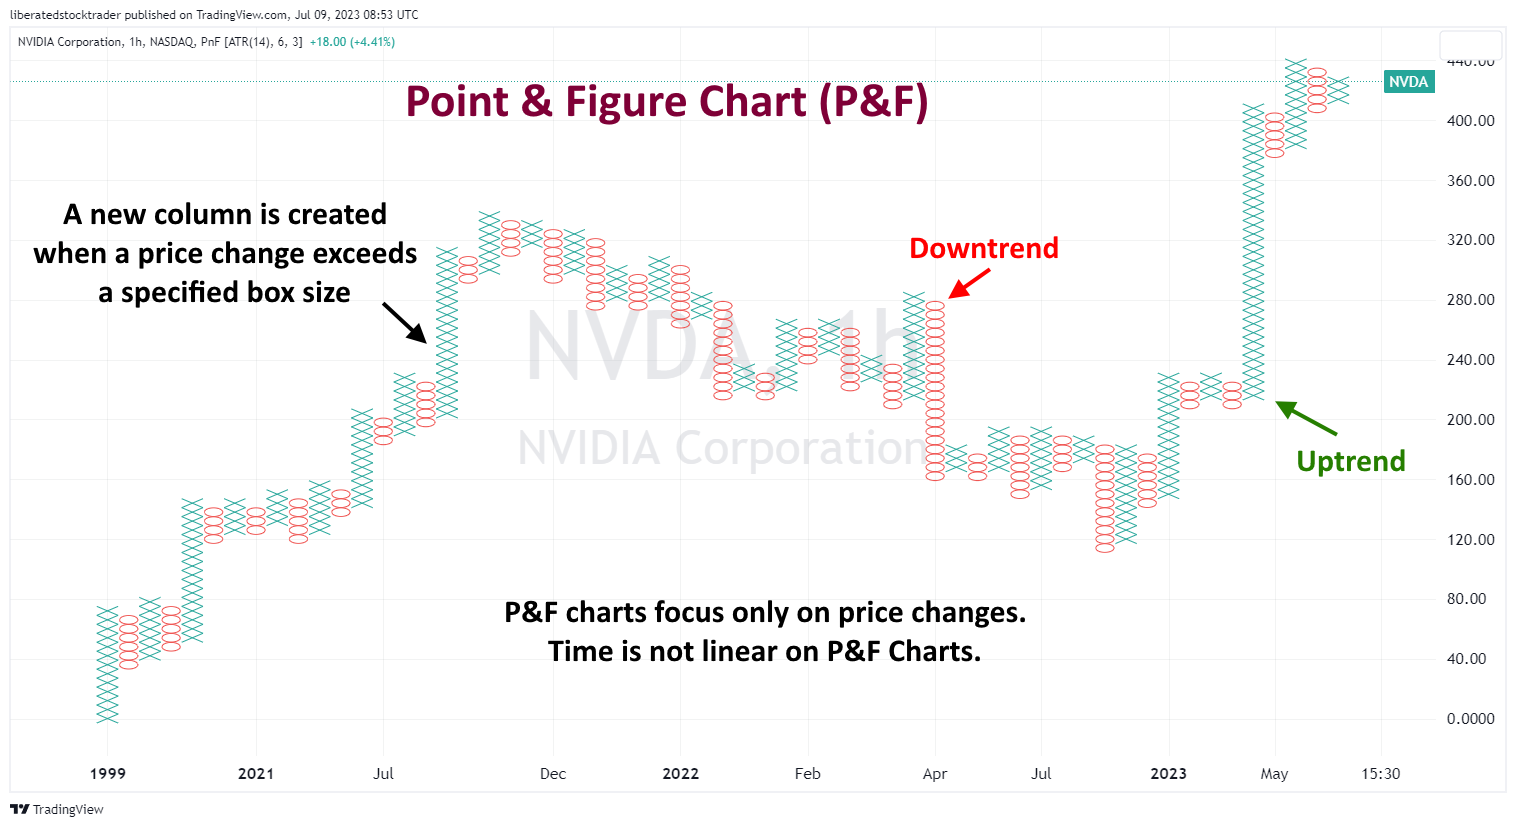
Point and figure charts simplify trading decisions by eliminating unnecessary noise from the markets, allowing you to focus on the big picture. Point and figure charts are one of the best chart types for trend traders, as they use only prices to plot points on a graph without considering time or volume. This makes identifying support/resistance levels and overall trends in any market easier.
Recognizing Chart Patterns
Chart patterns are visual formations created by price movements on your chart, which can indicate potential future price behavior. Familiar patterns include head and shoulders, signaling reversals, and triangles, denoting continuation or consolidation. Spotting these patterns early can give you a competitive advantage.
Today, the best stock software can automatically recognize candlestick and price patterns.
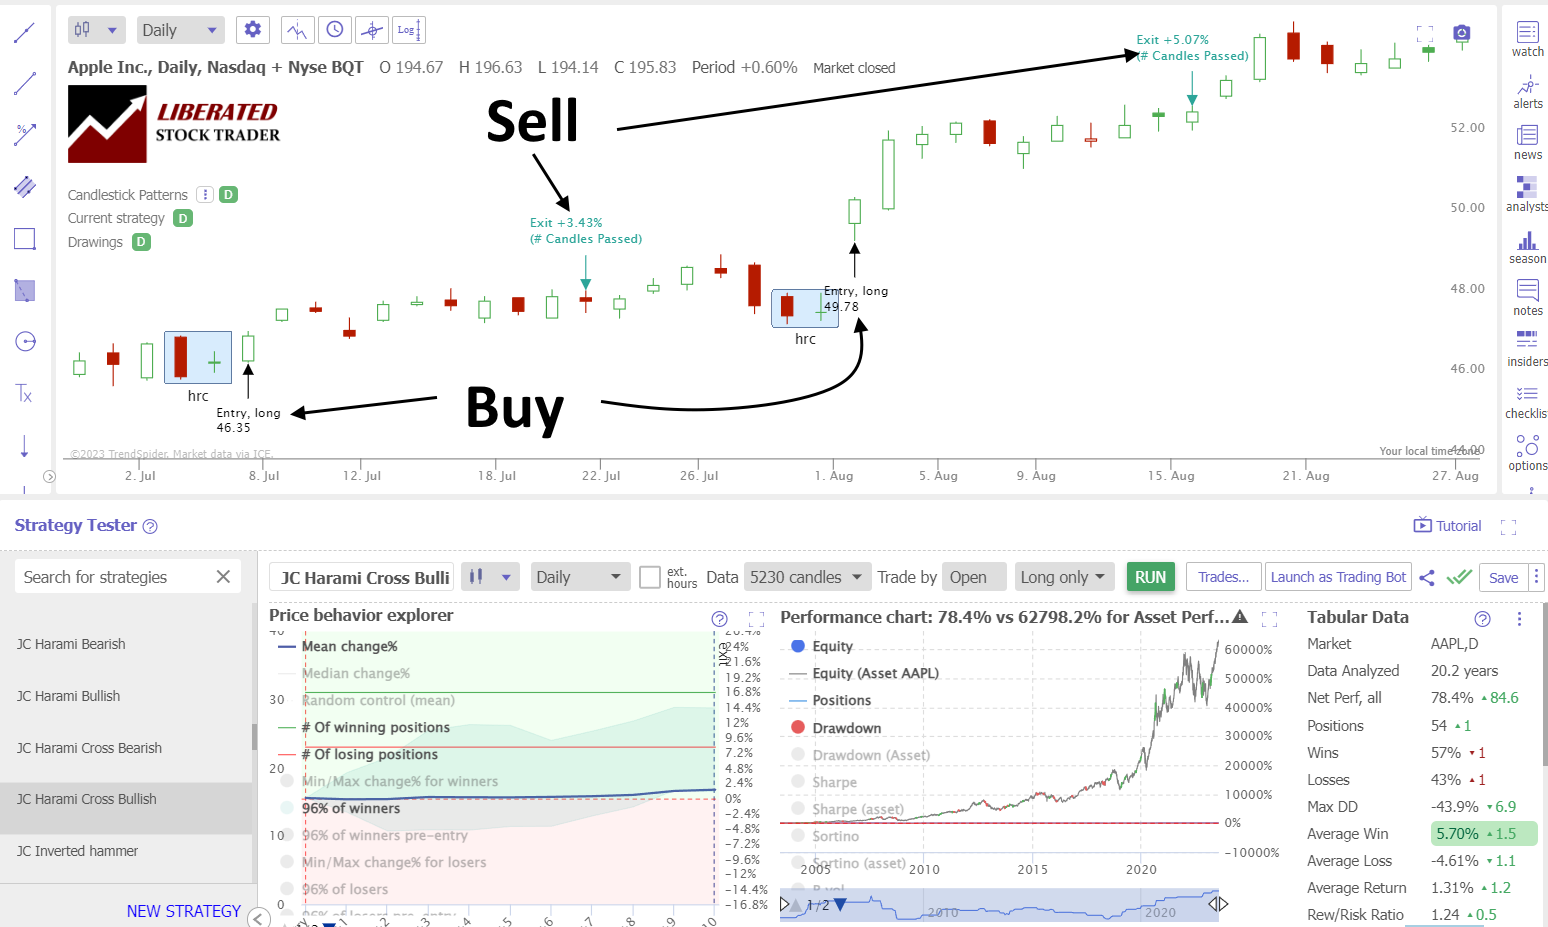
TrendSpider: The Best Pattern Recognition & Strategy Testing
For instance:
- Head and Shoulders: Suggests a reversal from uptrend to downtrend.
- Triangles: This could indicate accumulation before a breakout.
Trendlines and Price Levels
Trendlines are drawn on your charts to connect a series of lows or highs, establishing visible trends. Price levels, such as support and resistance, are horizontal lines that mark where price has historically struggled to move past. These tools combined help you determine the strength of a trend and potential reversal points.
- Support Level: Line under price action where buying interest is significantly strong and could prevent the decline of prices.
- Resistance Level: Line over price action where selling pressure may overcome buying interest and prices could drop.
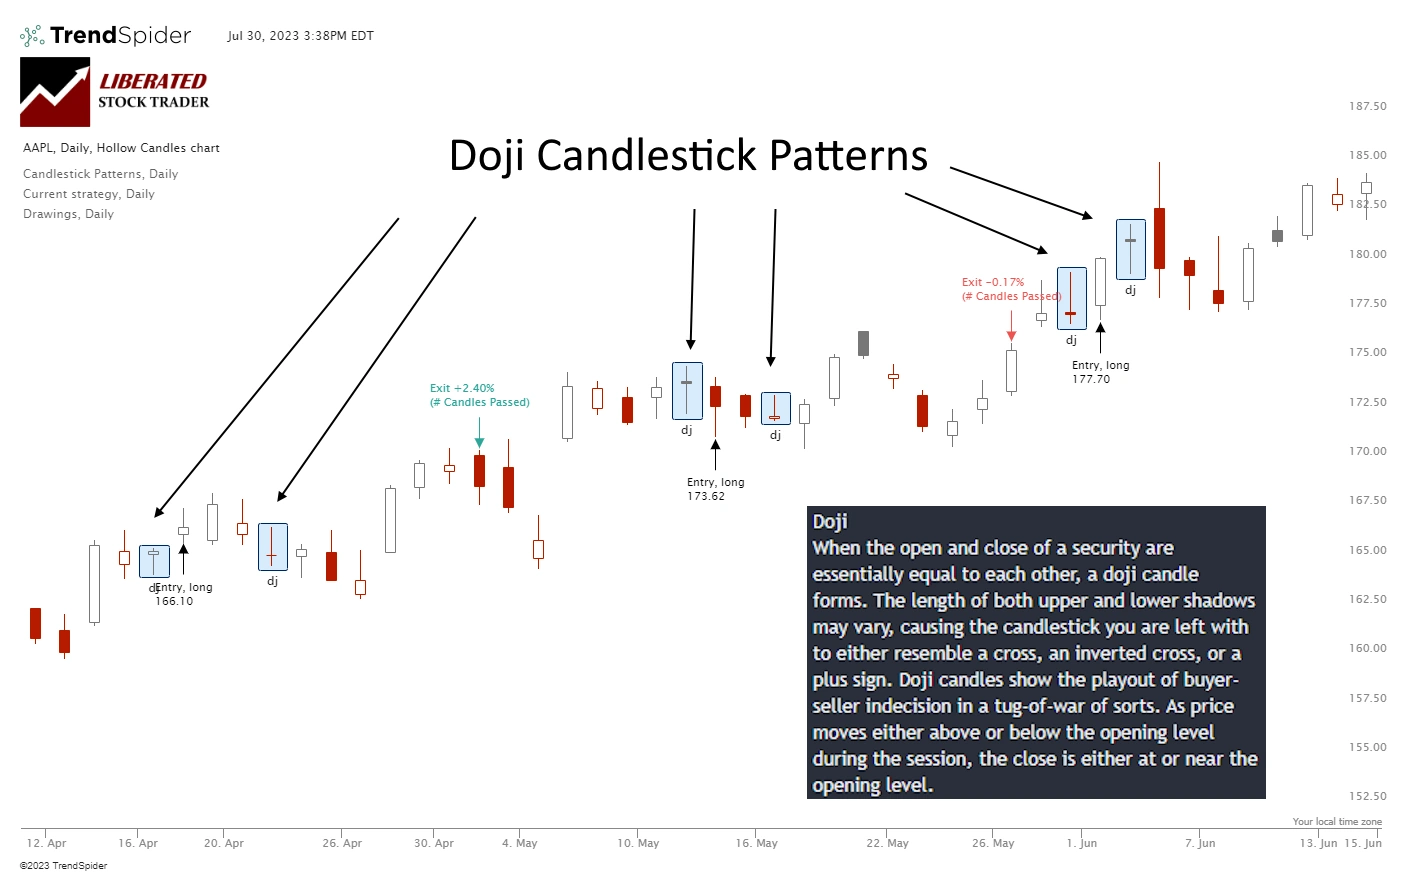
Candlestick Patterns
In price action trading, candlestick patterns are essential tools that can give you insights into market sentiment and potential reversals. They visually represent price movements within a specific timeframe, helping you make informed decisions.
Single Candlestick Patterns
You may encounter a variety of single candlestick patterns, each communicating a different market sentiment. Here are a few examples:
- Doji: This pattern indicates indecision in the market with its small or non-existent body and wicks of equal length on both sides.
- Hammer and Inverted Hammer: The hammer has a small body at the top of the candlestick with a long lower wick, suggesting a potential bullish reversal. The inverted hammer is similar but appears during downtrends, indicating a possible bullish turn.
- Shooting Star and Hanging Man: A shooting star is recognized by its small lower body and long upper wick, signifying a bearish reversal. The hanging man resembles a hammer but occurs at the end of an uptrend, suggesting a bearish shift.
Multi-Bar Patterns
Within multi-bar candlestick patterns, a greater context is found by examining the interaction between consecutive candlesticks.
- Bullish and Bearish Engulfing Patterns: When a small candlestick is followed by a larger one that completely overshadows it, an engulfing pattern is formed. A bullish engulfing occurs during a downtrend, indicating a potential upward move. Conversely, a bearish engulfing pattern during an uptrend could predict a downward shift.
- The Harami: This pattern is where a smaller candlestick follows a larger one, contained within its range, resembling a ‘pregnant’ form. A bullish harami occurs during a downtrend, while a bearish harami appears during an uptrend, each suggesting a possible reversal.
- Inside Bar: This pattern comprises a candlestick followed by another with a lower high and a higher low. It frequently indicates a consolidation before a breakout.
By mastering these candlestick patterns, you enhance your ability to predict market movements and fine-tune your trading strategies accordingly.
Understanding Price Movements
In price action trading, it’s crucial to interpret how the price of an asset moves and to recognize patterns within those movements. These patterns can give you insights into market sentiment and potential future price behavior.
Analysis of Trends
To effectively read trends, you’ll look for sequential higher highs and higher lows in a bullish trend or lower highs and lower lows in a bearish trend. The direction and duration of these trends can inform your trading strategy.
- Recognition: Use trend lines or moving averages to identify the trend direction.
- Duration: Short, medium, and long-term trends provide context for trading decisions.
Inspecting the strength of a trend is also informative. A strong bullish trend with substantial price movement can signal robust buying pressure.
Volatility and Price Fluctuations
Volatility refers to the degree of variation in the price of a trading instrument over a period of time. Higher volatility often leads to larger price fluctuations, which can be both a risk and an opportunity.
- Interpreting Volatility:
- High Volatility: This may signal uncertainty in the market, leading to a wider price range.
- Low Volatility: Often associated with less risk, featuring smaller price changes.
In trending markets, volatility can help you gauge the momentum behind a trend. Monitoring changes in volatility can provide insights into potential shifts from a trending market to a range-bound market or vice versa.
Support and Resistance
When you engage in price action trading, understanding the dynamics of support and resistance is crucial. These concepts influence entry and exit points and provide insights into market trends.
Identifying Key Levels
You’ll focus on historical price data to identify support and resistance levels. A support level is where the price stops falling and bounces back upwards, suggesting a concentration of demand. On the other hand, a resistance level is where the price stops rising and falls back, indicating a pool of supply.
| Price Points | Indicator | Description |
|---|---|---|
| Low Points | Potential Support | Price level where buyers are encouraged. |
| High Points | Potential Resistance | Price level where sellers are motivated. |
Look for at least three touches to confirm a level.
TrendSpider: The Best Pattern Recognition & Strategy Testing
Spring at Support and Resistance
Spring refers to a price movement through a support or resistance level, only to reverse direction quickly. Think of it as a false breakout or dead cat bounce, that can trap traders before the price returns to the dominant trend.
| Event | Implication |
|---|---|
| Spring at Support | This bullish signal indicates potential upward momentum as the price recoils off the support level. |
| Spring at Resistance | A bearish signal due to the failed attempt to break through the resistance level. |
Your ability to react promptly to these springs can significantly impact your trading outcome.
Trading Setups and Signals
In price action trading, understanding the right setups and signals is crucial for identifying when to enter and exit the market. These patterns and opportunities can significantly influence trading strategies.
Popular Price Action Patterns
Head and Shoulders: This reversal pattern can signal a change in trend direction. Look for two peaks (shoulders) with a higher peak (head) between them for a potential bearish turn.
Double Top and Double Bottom: These are reversal patterns. A double top signals a likely bearish reversal after an uptrend, while a double bottom indicates a potential bullish reversal following a downtrend.
Bullish and Bearish Flags: Short-term continuation patterns suggest the market is likely to continue in the direction of the prevailing trend after a brief consolidation.
Triangles:
- Ascending Triangle: Bullish pattern formed by a flat top and rising bottom.
- Descending Triangle: Bearish pattern with a flat bottom and descending top.
- Symmetrical Triangle: Indecisive, as price consolidates between converging support and resistance lines.
| Pattern | Implication | Potential Signal |
|---|---|---|
| Head and Shoulders | Bearish reversal | Sell |
| Double Top | Bearish reversal | Sell |
| Double Bottom | Bullish reversal | Buy |
| Bullish Flag | Continuation | Buy |
| Bearish Flag | Continuation | Sell |
Identifying Trading Opportunities
When observing the price chart:
- Support and Resistance Levels: These are critical areas where the price might experience pushback, halting or reversing a trend.
- Support: Price level where buying is strong enough to overcome selling pressure.
- Resistance: Price level where selling overwhelms buying, halting price increases.
- Trend Lines: Drawn on charts to connect consecutive highs or lows. Breakouts from these lines are used as entry or exit signals.
- Candlestick Formations: Single or multiple candlestick patterns provide insight into market sentiment. For instance, a ‘bullish engulfing’ may suggest a potential upward move, while a ‘bearish engulfing’ could signal a downward trend.
- Volume: An increase in volume during a pattern’s formation adds to the credibility of the potential signal.
Entry and Exit Points: Determine these points based on the convergence of signals from the identified patterns, support and resistance levels, trend lines, and volume. Your entry point marks the moment you open a position based on a perceived opportunity, while your exit point is when you close the position to either realize a profit or cut a loss.
Trading opportunities manifest when these factors align, giving a high probability of a price movement. Always manage risk and set stop losses, as even the most reliable patterns do not guarantee success.
You want to be a successful stock investor but don’t know where to start.
Learning stock market investing on your own can be overwhelming. There’s so much information out there, and it’s hard to know what’s true and what’s not.

Liberated Stock Trader Pro Investing Course
Our pro investing classes are the perfect way to learn stock investing. You will learn everything you need to know about financial analysis, charts, stock screening, and portfolio building so you can start building wealth today.
★ 16 Hours of Video Lessons + eBook ★
★ Complete Financial Analysis Lessons ★
★ 6 Proven Investing Strategies ★
★ Professional Grade Stock Chart Analysis Classes ★
Trading Strategies and Execution
Successful price action trading strategies require a nuanced understanding of trade entry and exit points. Your ability to analyze market movement patterns using these strategies can significantly impact your trading performance.
Price Action Trading Strategies
Price action trading utilizes direct analysis of movements in the market to inform trade decisions. Here are common strategies you may consider:
- Support and Resistance: Identify key levels where the price has historically struggled to break through. Support levels suggest a price point the asset doesn’t often fall below, while resistance levels indicate where the price tends not to exceed.
- Trend Analysis: Look for sequences of higher highs and higher lows in an uptrend or lower lows and lower highs in a downtrend. Joining these points can help you discern the strength of the trend.
- Candlestick Patterns: Pay attention to the shape and formation of candlesticks. Patterns like the ‘pin bar,’ ‘engulfing candle,’ and ‘inside bar’ can indicate potential market turns or continuation.
- Breakouts and Breakdowns: Watch for the price breaks above resistance or below support, which may signify a potential entry point for a trend’s continuation or reversal.
Entry and Exit Strategies
Your approach to determining entry and exit levels is pivotal for trade execution:
- Entry Points:
- Before entering a trade, seek confirmation of a price action signal, such as a candlestick pattern.
- Consider entering a trade when the price moves beyond a specific pattern, like a market breakout.
- Exit Points:
- Establish your exit strategy before entering the trade. Set a target price or use a trailing stop loss to protect profits.
- Be ready to exit a trade if the market conditions invalidate your original trade strategy, such as a reversal pattern against your position.
Your trading system should include predefined rules for how and when to enter or exit trades based on the above strategies. This systematized approach can prevent emotional decisions and ensure a disciplined adherence to your chosen price action trading methods.
Identifying Breakouts and Reversals
Identifying breakouts and reversals is fundamental in price action trading. These patterns signal potential entry points or warn of trend exhaustion, offering invaluable insights into market sentiment.
Breakout Patterns
A breakout occurs when the price moves with increased volume outside a defined boundary, such as support or resistance levels. To recognize breakout patterns, focus on the following:
- Consolidation Zones: Look for the price to move sideways between support and resistance, indicating accumulation or distribution.
- Volume Increase: A genuine breakout often comes with a surge in volume, reflecting the commitment of traders to the new trend.
- Candlestick Confirmation: A breakout candle should close outside the boundary to confirm the move; otherwise, it may be a false breakout.
Be alert for false breakouts, where the price momentarily breaches a boundary but then reverts within the range. They often occur with low volume and lack confirmation.
Reversals and Price Rejection
Reversals suggest a change in the prevailing trend and can be identified by:
- Trend Exhaustion: After an extended trend, watch for signs of a slowdown in momentum, such as shorter candlestick bodies and increased wicks.
- Price Rejection occurs when price attempts to continue in the trend’s direction but is pushed back, often leaving behind a long wick, signaling rejection of higher or lower prices.
To trade reversals effectively, confirm them with subsequent price action or indicators, as premature entries can result in losses. Look for patterns like head and shoulders, double tops/bottoms, or pin bar formations for reversal signals.
Technical Indicators in Price Action Trading
Technical indicators are essential tools in price action trading, providing you with signals and trends. They are based on past price data and volume, aimed at aiding your decision-making process.
Role of Volume and Moving Averages
Volume is a fundamental indicator showing how many shares or contracts are traded during a specific period. It confirms trends and chart patterns, giving weight to breakout signals. High volume indicates increased interest and robust price movements, while low volume may signal a lack of conviction among traders.
Stock Volume: How to Use Volume in Charts to Improve Trading
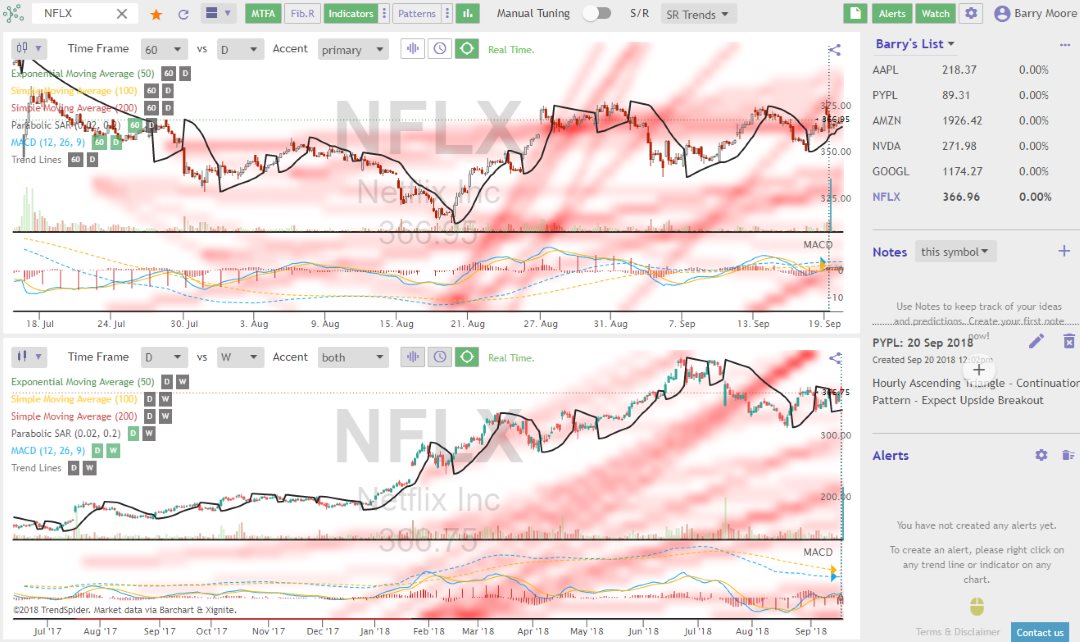
Moving averages smooth out price data to identify trends. A simple moving average (SMA) takes the arithmetic mean of a set of prices over several periods. Exponential moving averages (EMA) give more weight to recent prices and react more quickly to price changes than SMAs. You typically see traders using a combination of different moving averages to identify potential support and resistance levels.
- Key uses of moving averages:
- Identifying trends based on the angle of the moving average.
- Determining potential support and resistance levels.
- Cross-over systems, where traders look for shorter-period averages to cross over longer ones as a signal.
Lagging versus Leading Indicators
Lagging indicators confirm price movements and trends once they have been established. They are most useful during long-term trends for reasserting that a trend is ongoing. Leading indicators, on the other hand, attempt to predict future price movements and are often used to signal potential entry and exit points before the trends have fully formed.
- Examples of lagging indicators:
- Long-term moving averages.
- Bollinger Bands.
Lagging indicators help you to reinforce your confidence in a trend. However, reliance on lagging indicators alone may result in delayed entry and exit points. For the most effective use in price action trading, you should combine lagging and leading indicators to complement each other, providing a balance that helps confirm trends and anticipate market moves.
Risk Management and Psychology
In price action trading, understanding your risk tolerance and trading personality is crucial for making informed decisions and managing your trades effectively.
Assessing Risk Tolerance
To effectively manage your trades, you must first assess your risk tolerance. This involves understanding the level of variability in the market you are comfortable with, which influences the size of the positions you take. Consider creating a risk assessment table like the one below to help quantify your tolerance:
| Risk Level | Trade Size (% of total capital) | Expected Value Fluctuation |
|---|---|---|
| Low | 1% | Minimal |
| Medium | 2-3% | Moderate |
| High | 5% | Significant |
Allocate your capital according to this personalized risk profile, ensuring you do not exceed what you’re comfortable losing on a single trade.
The Impact of Trading Personality
Your trading personality affects how you respond to market conditions. For instance, if you’re bold and decisive, you might excel in fast-paced markets but be prone to over-trading. Conversely, a cautious trader may miss opportunities due to hesitation but could excel in risk control.
- Bold Traders: Quick decision-making, large position sizes, potential for high rewards and losses.
- Cautious Traders: Calculated entries, smaller positions, consistent but potentially lower returns.
Understanding these traits will allow you to tailor your trading strategy to your personality, maximizing your strengths and mitigating weaknesses.
Price Action Considerations for Specific Markets
When applying price action trading to different markets, you must recognize each market’s unique characteristics. Factors like liquidity, volatility, and market hours significantly influence how price movement is interpreted and acted upon.
Price Action in Forex
In the forex market, liquidity is king, and the market’s continuous operation allows for round-the-clock trading. Pay attention to the most traded currency pairs like EUR/USD and USD/JPY, as they often present clearer price action given their high liquidity. When examining forex charts:
- Look for consistent patterns, such as flags and wedges, as telltale signs of potential upcoming movements.
- Monitor Economic Releases: These can create sudden spikes and trends, presenting opportunities for trading.
It’s also imperative to monitor geopolitical events and interest rate changes by central banks, as these can cause significant price shifts.
Commodities and Equities
Trading commodities and equities require understanding different factors influencing their price action. With commodities, such as gold and oil, you should:
- Assess Supply and Demand Indicators: News related to changes in output, reserves, and consumption can drive prices.
- Consider Geopolitical Tensions: Especially with energy commodities, geopolitical events can cause dramatic price changes.
For equities, individual stock price action can be quite influenced by company performance, so:
- Analyze Earnings Reports: Companies releasing strong financials can experience a surge in stock prices.
- Watch Market Sentiment: Often, equities move in bigger cycles that reflect overall market sentiment so a broad market analysis would be beneficial.
Both commodities and equities are also affected by macroeconomic indicators like employment rates and GDP growth. Being aware of these can help you anticipate market movements.
Practical Tools for Traders
The success of price action trading hinges on selecting the right tools. As a trader, your utility belt should include a responsive platform and the practice opportunities of demo accounts to enhance your strategy.
Choosing a Trading Platform and Broker
When selecting a trading platform and broker, consider the following:
- User Interface: You want a platform that displays data clearly and executes orders promptly.
- Fees: Look for transparent fee structures without hidden costs. This could potentially save you from shrinking your profits unnecessarily.
- Regulation: Ensure that your chosen broker is regulated by a credible authority to provide you with peace of mind.
- Customer Support: A responsive and knowledgeable customer support team is crucial, especially when urgent issues arise.
| Key Feature | Why It Matters |
|---|---|
| Real-time Data | Accurate price quoting is essential for successful price action trading. |
| Charting Tools | Vital for analyzing price movements and making informed decisions. |
| Trade Execution Speed | Delays can lead to missing optimal entry and exit points. |
| Security | Your funds and personal information must be protected. |
Leveraging Paper Trading Accounts
Paper Trading offers the following benefits:
- Risk-Free Environment: Test strategies with virtual money, which allows you to gain experience without the risk of actual financial loss.
- Platform Familiarity: Use a demo account to familiarize yourself with platform features and tools before committing real capital.
- Testing Strategies: Apply price action techniques in various market conditions to see what works best for your trading style.
Remember, while demo accounts are valuable for practice, they cannot fully replicate the psychological pressures of real trading. Use them as a learning tool, not a guaranteed predictor of success.
Patterns and Formations
Recognizing specific patterns and formations in price action trading is crucial to understanding potential market movements. These patterns indicate bullish or bearish trends and help determine strategic entry and exit points.
Triangles and Range Patterns
Triangles appear on charts when price action begins to tighten, and these can be broken down into ascending, descending, and symmetrical patterns. Ascending triangles are typically seen as bullish and form with a flat upper trend line and an ascending lower trend line. Conversely, descending triangles suggest a bearish sentiment with a flat lower trend line and a descending upper trend line. For symmetrical triangles, price consolidation occurs with both trend lines converging at an approximately equal slope, signaling a period of indecision.
23 Best Stock Chart Patterns Proven Reliable By Data Testing
Range patterns, or trading ranges, occur when the price fluctuates between consistent high and low price points, establishing a horizontal or sideways trend. These patterns signify a period when the market assesses its next significant move. Within a range, you typically observe the following:
- Support level: The price point where buying is strong enough to overcome selling pressure.
- Resistance level: Conversely, the point where selling pressure overtakes buying momentum.
Head and Shoulders and Double Tops
Head and Shoulders is a pattern that predicts a reversal of a prior trend and contains three peaks—the middle peak (head) being the highest and the two other peaks (shoulders) on either side being lower. A line of neckline can be drawn by connecting the low points of the two troughs on either side of the head. The pattern completes when the price action breaks through the neckline, indicating a potential sell signal.
The Double Top is a reversal chart pattern that resembles the letter “M” and signifies a turnaround from a bullish trend to a bearish one. It is characterized by two consecutive peaks of similar height with a trough in between. Key elements include:
- The first peak signals the highest point of the current trend.
- The trough following the peak suggests a temporary decline.
- The second peak indicates the market’s attempt and failure to surpass the previous high.
Typically, the double-top pattern confirmation comes when the price falls below the trough level between the two peaks, suggesting a potential sell-off may occur.
Market Influences
In price action trading, market behavior is chiefly influenced by supply and demand dynamics and a range of external factors. These forces interact to drive the current price, shaping the trading landscape you navigate.
Supply and Demand Dynamics
Supply and demand are the cornerstones of the market. You can visualize these dynamics with a supply and demand curve. The point where the supply curve—illustrating the quantity of a good that sellers can produce at different prices—and the demand curve—representing the quantity buyers are willing to purchase—intersect denotes the equilibrium price.
- Increase in Demand: When more buyers enter the market, demand rises, shifting the demand curve to the right, typically leading to a higher price.
- Increase in Supply: Conversely, if sellers increase their market presence, the supply curve shifts to the right, which can result in a lower price, barring any changes in demand.
These curves are not static. News, economic reports, and market sentiment are pivotal in shifting these curves, reflecting changes in traders’ willingness to buy or sell.
External Factors Affecting Price Action
External factors beyond pure supply and demand significantly impact the price actions you observe. Here, we will discuss key external factors influencing the market:
- Economic Data: Publications such as GDP reports, employment statistics, and inflation figures influence market perception and, consequently, price action.
- Political Events: Elections, policy changes, and international relations can cause rapid shifts in market sentiment.
- Market Sentiment: Prevailing attitudes and outlooks of market participants, often in response to news or global events, can drive prices independently of fundamental data.
| External Factor | Potential Impact on Price Action |
|---|---|
| Positive Economic Data | This may lead to an increase in the current price |
| Geopolitical Unrest | Could cause a decrease due to uncertainty |
| Shift in Market Sentiment | This can lead to swift and volatile price changes |
As a trader, your ability to assess how these elements influence the ever-fluctuating price landscape is vital for making informed decisions in price action trading.
Advanced Price Action Techniques
When employing advanced price action techniques, it’s essential to understand the intricacies of positioning for risk and the subtleties of candlestick analysis to interpret signals and patterns accurately.
Position Sizing and Leverage
The choice of position size and leverage are crucial components in managing risk. You need to align your position sizing strategy with your risk tolerance and the asset volatility you are trading.
- Leverage: Applying leverage can amplify gains and increase the risk of significant losses. Use it judiciously, and avoid over-leveraging.
- Risk Management: A common approach is to risk only a small percentage of your account on a single trade, often between 1% to 2%.
A flexible approach allows adjustments according to market conditions and your trading performance.
Advanced Candlestick Analysis
Advanced candlestick analysis extends beyond simply recognizing patterns; it involves understanding the psychology behind price movements and applying that knowledge to forecast potential trend reversals or continuations.
Trading Styles
Your approach can significantly vary in price action trading depending on the trading style you adopt. Each style requires a different set of skills and a unique kind of market analysis. Understanding these differences is key to choosing the style best suits your trading goals and risk tolerance.
Day Trading with Price Action
Day trading involves buying and selling financial instruments within the same day, capitalizing on small price movements. When you day trade using price action, you focus on real-time price movements and chart patterns, ignoring most fundamental analysis.
- Timeframe: Typically, you’d use lower time frame charts, such as 1-minute to 15-minute charts, to make quick decisions.
- Decision Factors: You should look for specific price action signals, including pin bars, engulfing bars, and inside bars, to make informed trades.
- Risk Management: Set tight stop-losses and have clear profit targets to manage risks effectively.
Pros of Day Trading with Price Action:
- Can capitalize on small price moves
- No overnight market risk
Cons of Day Trading with Price Action:
- Requires constant market monitoring
- High transaction costs due to frequent trading
Swing Trading Strategies
Swing trading is a style where trades are held over several days to capitalize on expected directional moves in the market. As a swing trader, you rely on price action to pinpoint entry and exit points, leveraging the momentum of market trends.
- Timeframe: You’ll typically monitor daily to weekly charts to identify trade setups.
- Decision Factors: Identify patterns such as triangles, flags, and retracements for entry and exit signals.
- Risk Management: Use wider stop-losses compared to day trading and adjust them as the trade moves in your favor to lock in profits.
Pros of Swing Trading Strategies:
- Less time-consuming than day trading
- Allows for larger profit potential on individual trades
Cons of Swing Trading Strategies:
- Requires patience to wait for the right trade setup
- Overnight and weekend market risk
FAQ
How can I develop a successful price action trading strategy?
To develop a successful price action trading strategy, you need to begin by understanding the historical price movements of your chosen market. Analyze past price patterns, volumes, and trends to identify potential trading opportunities. Practice with a demo account to refine your strategy without financial risk.
Which books are recommended for learning about price action trading?
"Technical Analysis of the Financial Markets" by John J. Murphy provides comprehensive coverage for learning about price action trading. Additionally, "Price Action Breakdown" by Laurentiu Damir can offer focused insights on deciphering and trading price action.
What are some common price action patterns traders look for?
Traders often look for patterns such as the head and shoulders, double tops and bottoms, and triangle formations. Each pattern signifies potential market movement, with pin bars, engulfing candles, and inside bars particularly indicative of future price action.
How can I use indicators to complement price action trading?
Indicators such as moving averages, Relative Strength Index (RSI), and Moving Average Convergence Divergence (MACD) can complement price action trading. Use them to confirm trends indicated by price action or to signal potential reversals, thereby adding layers of confirmation to your strategy.
What are the key elements to consider when analyzing price action on charts?
When analyzing price action on charts, observe the trend direction, momentum, volume, and support and resistance levels. Pay attention to the context of price movements and consider the bigger picture they fit into, not just the individual price changes.
Can you suggest an effective entry and exit strategy based on price action?
For an effective entry strategy based on price action, consider entering trades on the break of a price pattern confirmation or when a price level, such as support or resistance, is tested and held. For exits, set stop losses near recent swing highs or lows and take profits when the price appears to be losing momentum or reverses to respect technical levels.


 Settings Tested on 43,297 Trades")
