The Relative Strength Index (RSI) is an oscillating momentum indicator that measures the speed and change of stock price movements.
I backtested four RSI indicator trading setups from 1-minute to daily charts across the DJ30 stocks from 1 month to 27 years, equaling over 820 years of testing data.
Can the RSI make you a profitable trader?
Not all RSI configurations work, but I discovered the most profitable RSI indicator settings. Strap in for a deep dive into mastering this indicator!
KEY TAKEAWAYS
- When configured correctly, RSI can be highly profitable.
- RSI has a 53% success rate based on multiple backtests using RSI-14 on an hourly chart.
- RSI is an oscillating indicator that measures the speed and change of price movements.
- RSI oscillates between 0 and 100.
- Readings above 70 indicate an overbought market, while readings below 30 indicate an oversold market.
- Selecting the right stock for RSI can produce large gains.
What is the Relative Strength Index (RSI)?
Relative Strength Index, or RSI, is a technical analysis indicator that charts the strength and speed of a market’s price movement. RSI measures the magnitude of recent gains and losses over a specified period, typically 14 days, creating an oscillator that moves between 0 and 100.
RSI can determine whether a stock is overbought or oversold and helps traders identify higher probability entry and exit points. It can also help traders assess the momentum of a stock’s price movement, which could then inform decisions on when to enter or exit trades.
How to Trade RSI: Buy & Sell Signals
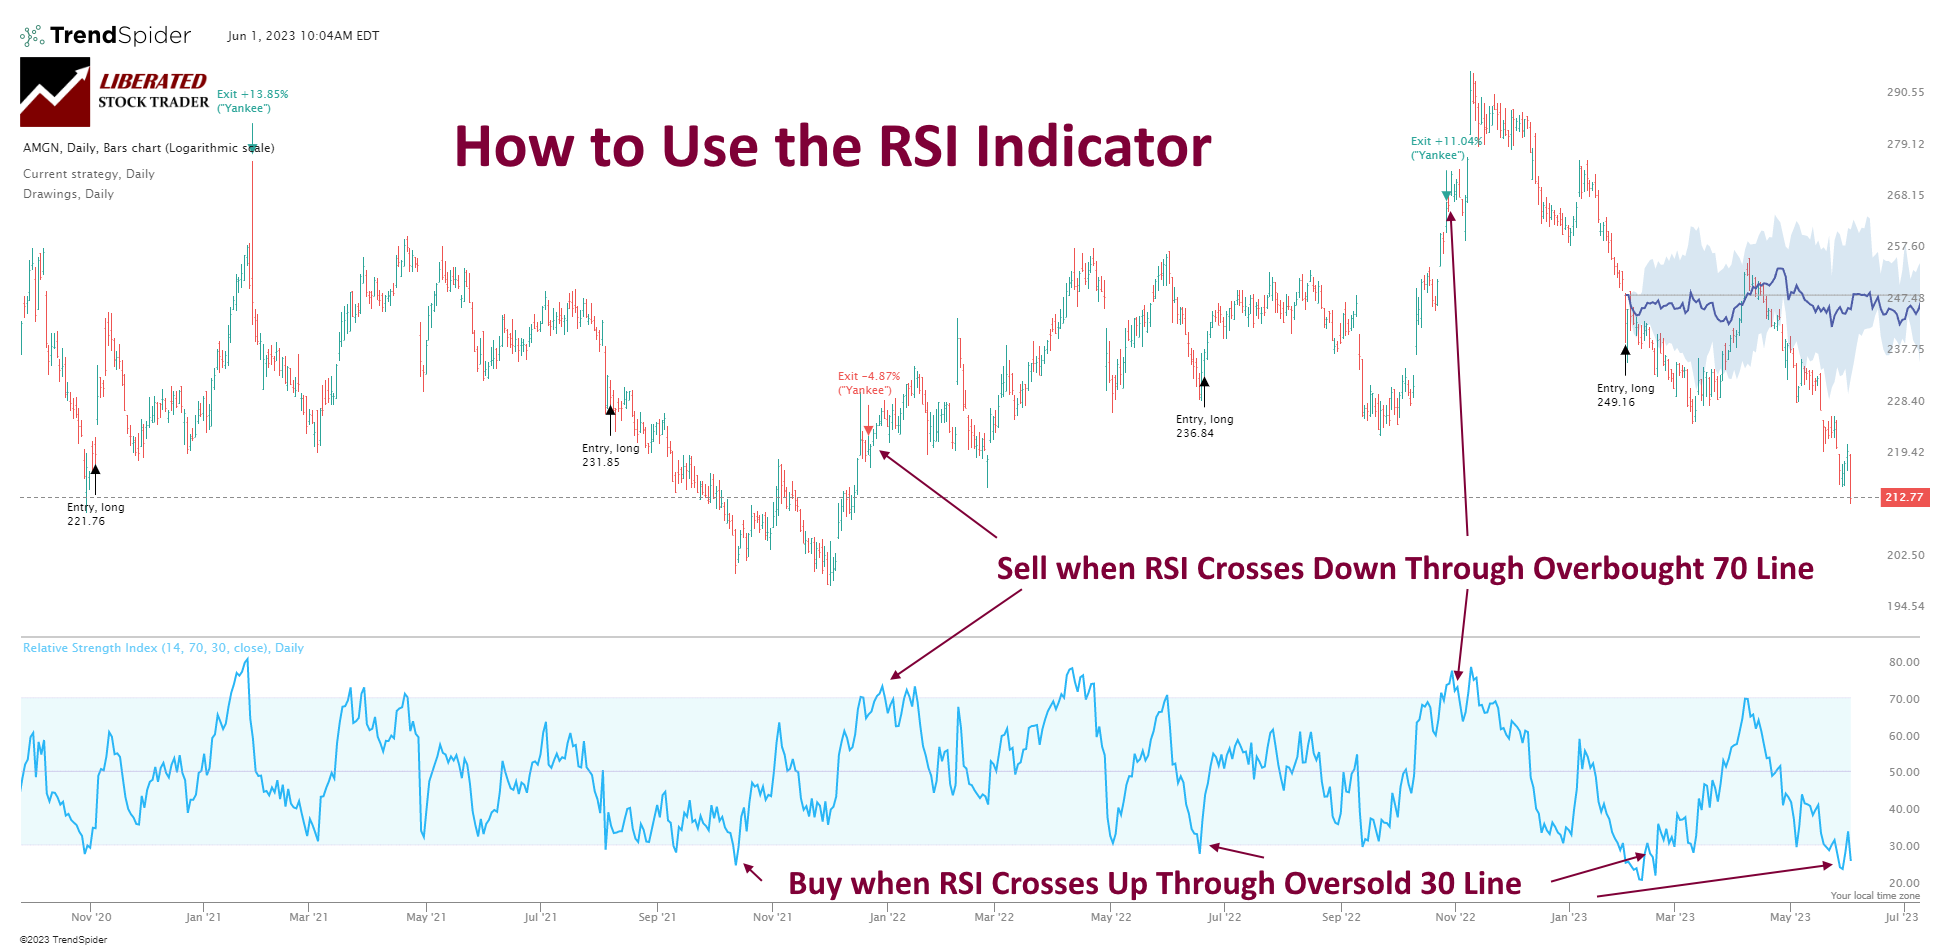
To trade using the RSI indicator, traders will look for buy and sell signals based on the value of the RSI oscillator. When the RSI exceeds 70, it indicates an overbought market, meaning price increases may slow down and reverse. The typical trigger for selling an asset is the RSI line crossing down through the 70 mark.
For an RSI sell signal, traders will look for the oscillator to dip below 30. When the RSI is below 30, it indicates an oversold market, meaning that price decreases may slow down and reverse. The typical trigger for buying an asset is the RSI line crossing up through the 30 mark.
See the chart below for details on RSI buy and sell signals.
But the question is, are the RSI buy and sell signals profitable like the ROC indicator? Or is the RSI another chart indicator that does not work, such as moving averages?
Price Divergences
The second way to trade the RSI is by looking for divergences between price and RSI. When the price makes a lower low, but the RSI doesn’t make a lower low, this is called a bullish divergence. Conversely, with a bearish divergence, the price makes a higher high, but the RSI doesn’t make a higher high.
These divergences indicate that the price and RSI are moving in different directions, which could indicate an upcoming reversal. The chart below illustrates a bullish divergence, with prices making lower lows and RSI making higher lows. This indicates the potential for the trend to reverse in an upward direction.
Watch the market closely for potential trading opportunities if you see a divergence. Confirmation of a reversal is best achieved by waiting for the price or RSI to break a support/resistance line and enter into the new trend. If you get too eager and jump in before confirmation, you could find yourself on the wrong side of any upcoming price movement.
We independently research and recommend the best products. We also work with partners to negotiate discounts for you and may earn a small fee through our links.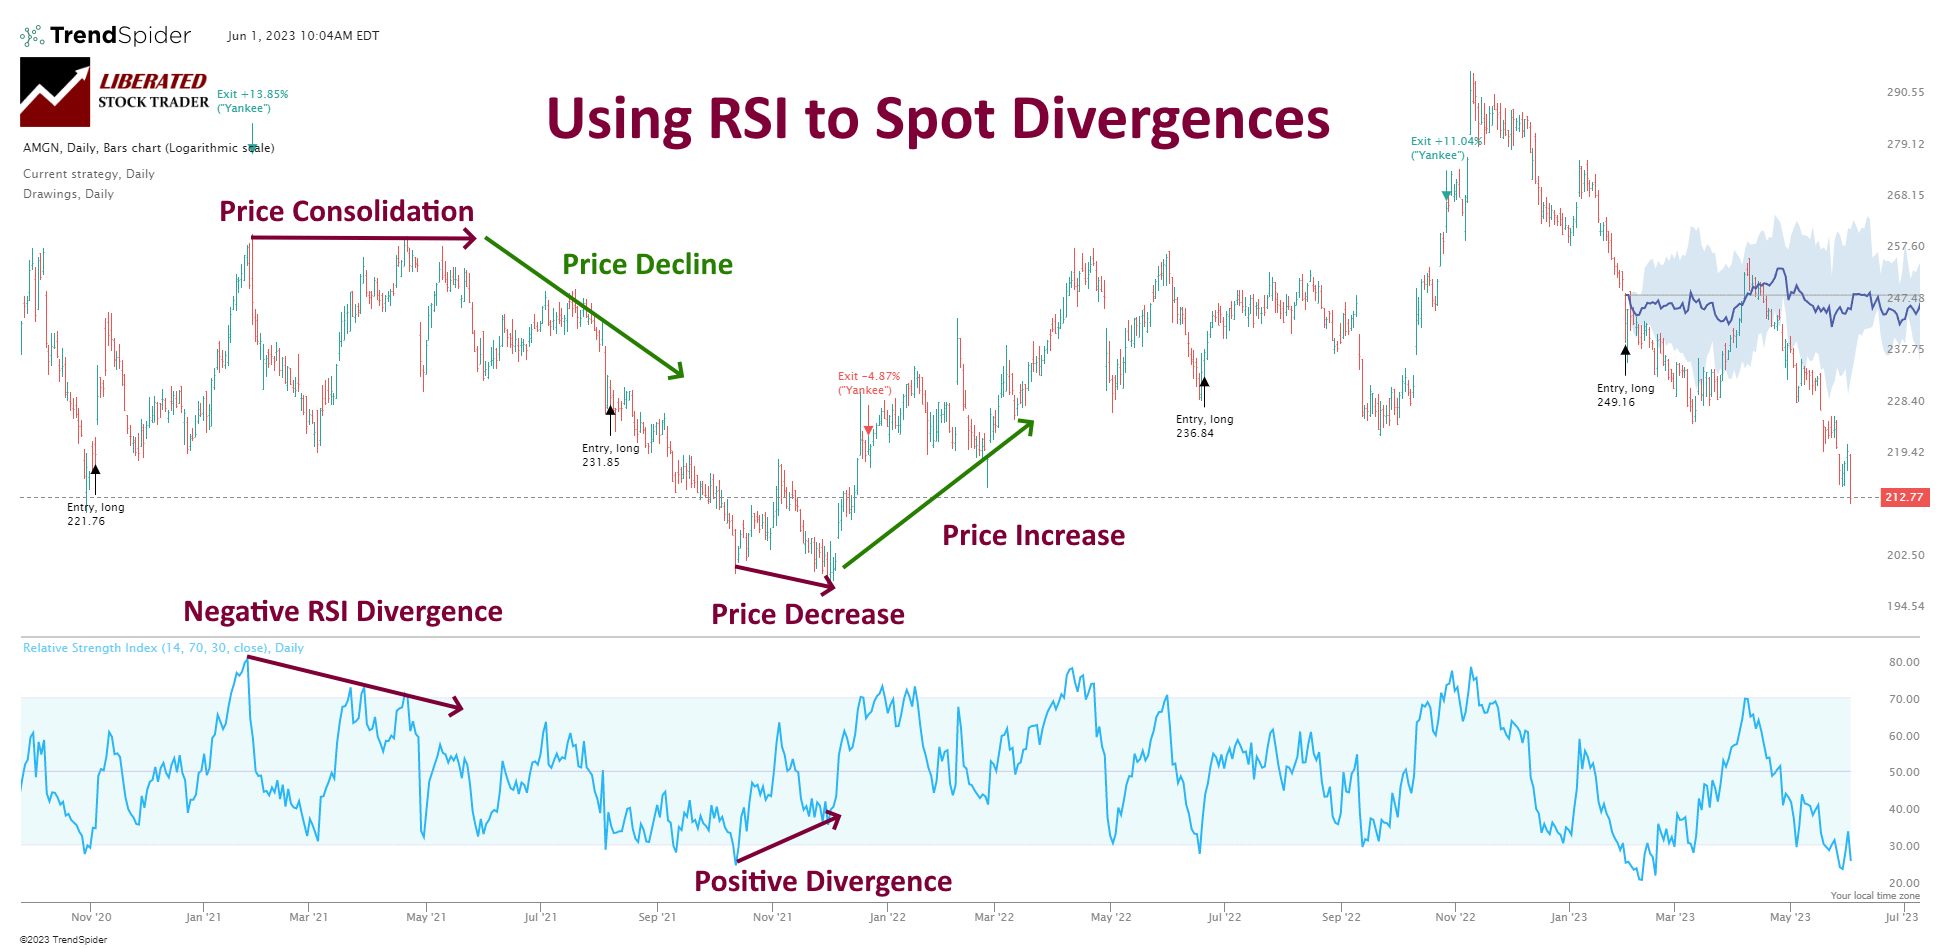
A divergence occurs when the price and RSI readings move in opposite directions and can signal a potential trend reversal. The problem with divergences is that they cannot be accurately measured using backtesting systems. So, we will use the overbought and oversold conditions for our indicator testing.
My thorough testing awarded TradingView a stellar 4.8 stars!
With powerful stock chart analysis, pattern recognition, screening, backtesting, and a 20+ million user community, it’s a game-changer for traders.

Whether you're trading in the US or internationally, TradingView is my top pick for its unmatched features and ease of use.
Explore TradingView – Your Gateway to Smarter Trading!
How to Calculate RSI
RSI is automatically calculated using the best charting software, such as TrendSpider or TradingView. But if you want to calculate RSI yourself, read on.
The RSI indicator is calculated using the following formula:
RSI = 100 – (100 / (1 + RS))
Where “RS” is the Relative Strength Index. This value is calculated by dividing the average gain over a certain period by the average loss.
The RS Relative Strength Index is calculated by dividing the average gain over a certain period by the average loss. This value is then used to calculate the RSI indicator. To determine the average gain, add up all of the positive price changes over a given amount of time and divide this total by the number of periods.
To calculate the average loss, add up all of the negative price changes over a given time and divide this total by the number of periods. Once these values are determined, divide the average gain by the average loss and use this ratio to calculate RSI.
The RSI uses a range of 0-100, with 50 being the midpoint. Values above 50 indicate an upward price trend, while values below 50 indicate a downward trend. When values are around 70 or higher, it indicates that the asset is overbought, and when they are around 30 or lower, the asset is considered.
Pros
One of the main benefits of using RSI is that it helps identify overbought and oversold conditions in a security or market. This can help traders make better decisions on when to enter and exit positions, improving their chances of success and helping them manage risk more effectively.
RSI is also relatively easy to calculate and interpret, making it an accessible indicator for traders of all experience levels. Finally, the RSI can identify divergences between price movements and security or the market’s underlying strength or weakness, which can help confirm trend reversals.
Cons
One of the biggest drawbacks to using RSI is that it can produce false signals. For example, when a security moves into overbought or oversold territory and stays there for an extended period, the RSI may give misleading buy or sell signals.
How I Set Up RSI Backtesting
To set up RSI backtesting in TrendSpider, follow these steps:
- Register for TrendSpider
- Select Strategy Tester > Entry Condition > Add Script > Add Parameter > Condition > Indicator > RSI 14, Crossed Up Through > Constant Level = 30.
- For the Sell Criteria, select > Add Script > Add Parameter > Condition > Indicator > RSI 14, Crossed Down Through > Constant Level = 70.
- Finally, click “RUN.”
Backtest Your Strategies on TrendSpider Now
Using the award-winning TrendSpider software, we can easily test any indicator, chart pattern, or chart performance on any US stock. Our Trendspider review reveals it offers the most powerful trading strategy development and testing service.
Backtesting Results
I tested the standard configuration of RSI 14 on the Dow Jones Industrial Average stocks on four timeframes: 1-minute, 5-minute, 1-hour, and daily charts, and the results were surprising. On a 1-minute chart, RSI produced only a 20% success rate, and a 5-minute chart over 1 month produced only a 23% win rate.
Interestingly, the standard setting of RSI 14 on a daily chart, widely recommended by supposed experts, only produced a 20% win rate.
| RSI Indicator Results | OHLC Chart | Duration | % Winners | Avg # Trades |
| RSI 14,70,30 | 1-min | 20 Days | 20% | 19 |
| RSI 14,70,30 | 5-min | 1 Month | 23% | 8 |
| RSI 14,70,30 | 1-hour | 4 Years | 53% | 10 |
| RSI 14,70,30 | Daily | 27 Years | 20% | 20 |
| Average | 28% | 12 |
The Best RSI Settings
Our 820 years of backtests revealed conclusively that the best setting for RSI is using RSI-14 on an hourly chart. This produced a win rate of 53% versus a buy-and-hold strategy. That might not seem like more than a 50-50 chance of success. However, some of the profitable stocks were incredibly successful.
Next, I will show a selection of those successful trades.
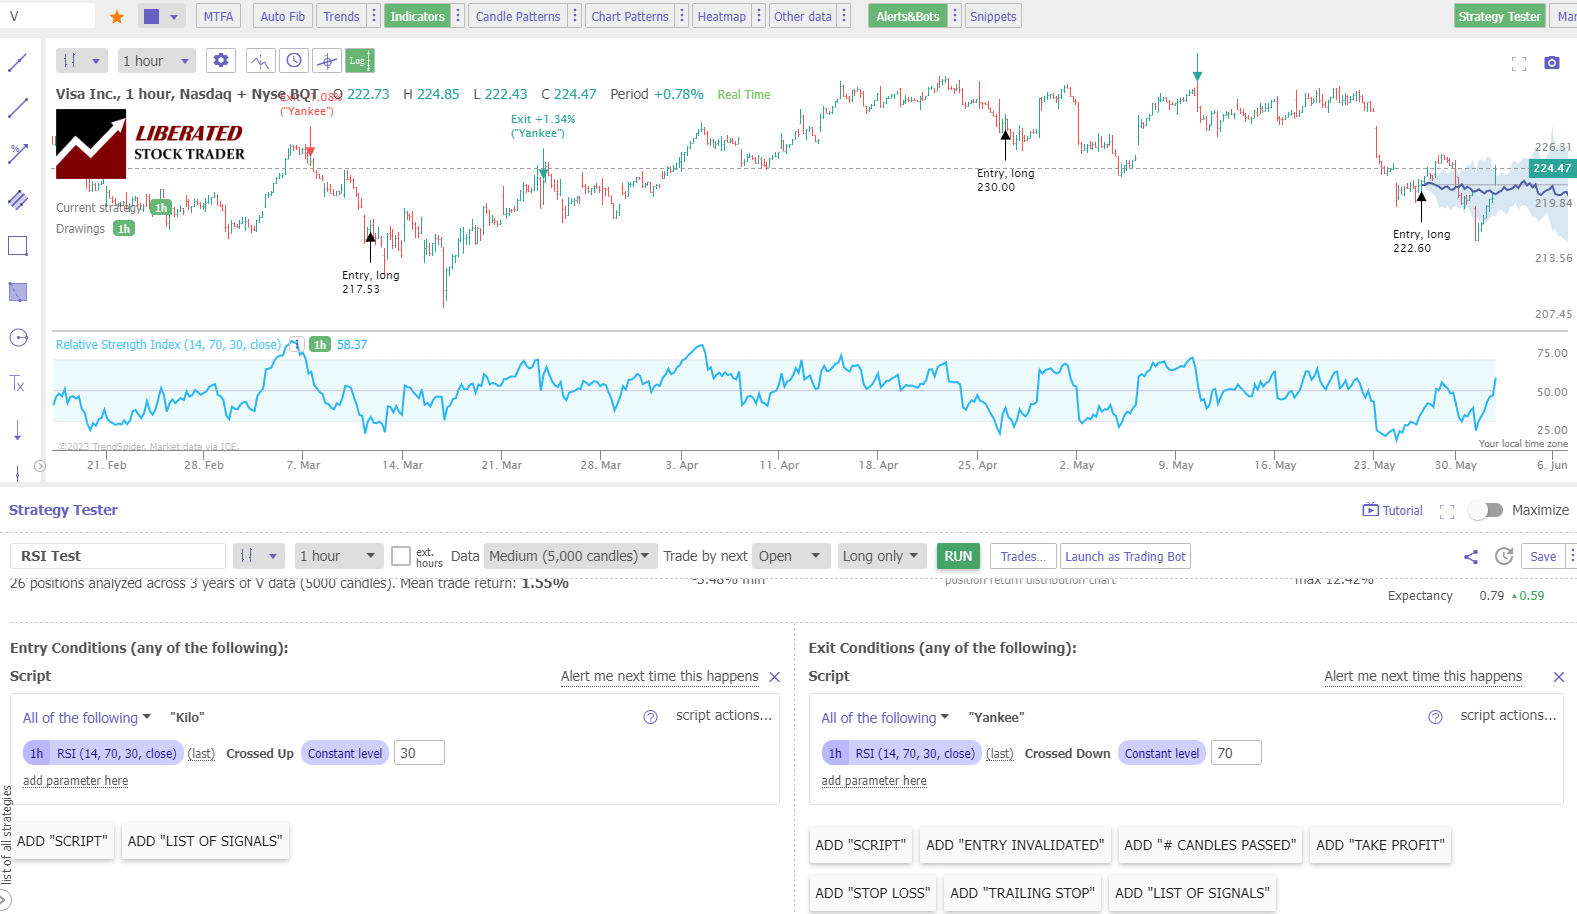
A 12-Year RSI Indicator Test
Our testing of Visa Inc (Ticker: C) on a 1-hour chart over three years shows an RSI-14 strategy returning a profit of +53% versus the buy-and-hold return of 11.75%. There were 26 trades with an average win of 3.42% versus a loss of -1.97%. 65% of trades were winners.
This was an impressive result, although not typical of all stocks in the test.

Backtest Powerful Strategies on TrendSpider Now
A 19-Year RSI Test on a Daily Chart
Our testing of International Business Machines over 19 years shows the RSI strategy returned a profit of +112% versus a buy-and-hold return of 46%. This is a vastly superior return, with 62% of trades being winners, with an average trade return of 4% versus losses of 1.95%.

Get Point & Click Backtesting on TrendSpider
Losing Trades
If you had traded Boeing stock over the last 19 years using a standard RSI-14 strategy, you would have made only a 4.63% profit versus a buy-and-hold strategy profit of 375%. This highlights that you must select the right stocks to trade. Boeing is a cyclical stock and has suffered greatly due to the Covid lockdowns, technical engineering issues, and lack of demand.

If a stock is in a long-term downtrend, you are unlikely to make profits with a buying long strategy using any indicator.
Testing RSI on the S&P 500
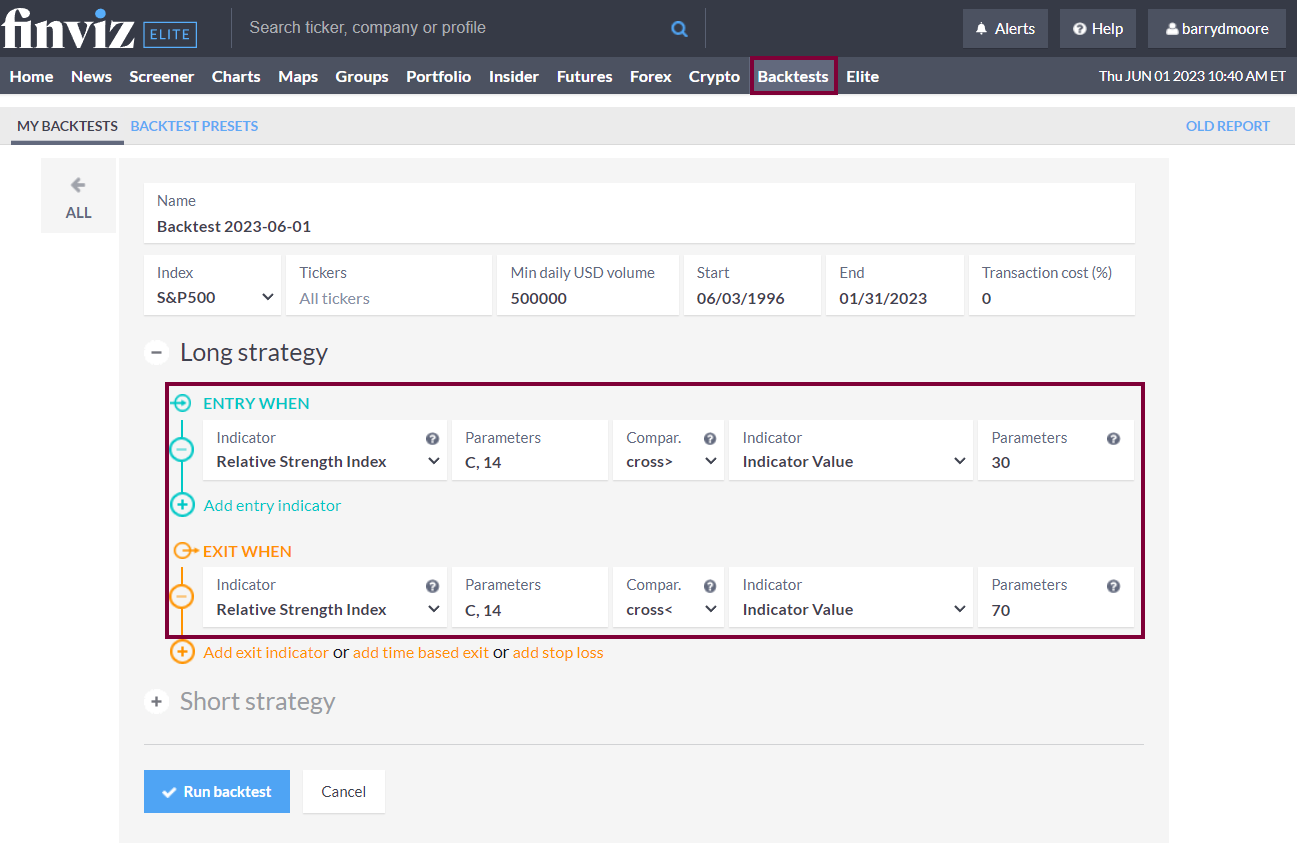
To test the RSI indicator on the largest US stocks in the S&P 500, I used the excellent backtesting solution provided by FinViz Elite. Finviz’s point-and-click backtesting engine allowed me to test RSI-14 on a daily chart over the previous 26 years. Here are the results.
Backtesting RSI Using FinViz Elite.
To set up RSI backtesting in FinViz, follow these steps:
- Register for FINVIZ,
- Select Backtests > Index=S&P500 > Entry When > Indicator > Relative Strength Index > Parameters 14 > Comparison= “Cross>” > Indicator Value = 30.
- For the Sell Criteria, select Entry When > Indicator > Relative Strength Index > Parameters 14 > Comparison= “Cross< “> Indicator Value = 70.
- Finally, click “Run Backtest.”
Easy Stock Market Backtesting with Finviz
26-Year RSI Indicator S&P500 Test Results
Backtesting the RSI indicator across the entire S&P500 index from 1996 to the present showed a 1282% return versus a buy-and-hold strategy profit of 881%. This means RSI on a daily chart outperformed the S&P 500 by 45% over 26 years.
This FinViz result is impressive; 500 stocks were tested over 26 years, and the results took 30 seconds to produce. This is broad market proof that the RSI indicator is worth trading.

Combining RSI with Other Indicators
The RSI indicator can be combined with other technical indicators to form a complete trading strategy. Look at our other research on MACD, Moving Averages, Heikin Ashi charts, Price Rate of Change, Aroon, KST, or even bullish chart patterns.
To test whether combining RSI with other indicators is profitable, I suggest using TrendSpider, our recommended stock research and AI-powered trading software.
Can the RSI be used for Buy and Sell Signals?
Yes, with 820 years of data across 30 Dow Jones stocks, our research shows that the standard RSI setting of 14 on a 1-hour chart is the best configuration for identifying profitable buy and sell signals with a 53% success rate and 65% average winning trades.
Should You Use the RSI Indicator?
Yes, our testing shows that using RSI with its standard setting of 14 is a profitable tool for trading. It beat the S&P 500 over 26 years by 45% and produced 53% winning trades on the Dow Jones Industrial stocks.
Is the RSI Indicator Accurate?
Yes, the RSI indicator is accurate; RSI-14 on an OHLC or candlestick chart beat the S&P 500 index with a total return over 26 years of 1,283% versus 881% for buy-and-hold investors. Our research on the DJIA indicates that RSI has a 53 percent win rate.
Summary
After testing 820 years of data, it’s safe to say that using RSI as a trading indicator on OHLC charts for buying and selling is generally a winning strategy. Use this indicator on hourly charts, using the RSI-14 setting to improve your chances of trading profitability.
FAQ
Is RSI a good indicator?
Yes, our research shows that RSI is a good indicator on a 1-hour candlestick chart with a setting of 14, producing a 53% success rate and over 53% winning trades. Our 26-year test of RSI on the S&P500 produced a market-beating performance of 1282% vs. a buy-and-hold performance of 881%.
What is the best setting for RSI?
Our testing shows that the best setting for RSI is 14 on an OHLC 1-hour chart which yields a 53% win rate. RSI-14, on a daily chart, also outperformed the S&P 500 returns over 26 years by 45%.
What indicators are better than RSI?
While RSI is a profitable indicator, others have higher success rates, such as the rate of change and chart patterns. Our testing has proven these indicators to be more effective, work on many timeframes, and are more successful in trading strategies.
Is RSI the best indicator?
No, while RSI is a very good indicator for trading, with a 53 percent success rate, bullish chart patterns such as the Double Bottom have an 88 percent success rate. I recommend learning to backtest and fine-tune trading strategies with TrendSpider for trading success.
What is the best time frame for RSI?
The best timeframe for RSI is a 14 setting on an hourly chart, which produced a 53 percent win rate, according to our research. We conducted a 26-year backtest and found RSI-14 on a daily chart produces a 54% success rate.
How reliable is RSI?
RSI is a reliable technical analysis chart indicator. Our 820 years of backtested data on 30 major US stocks show a 53% chance of beating a buy-and-hold strategy on a daily OHLC chart. Also, a 26-year backtest on the S&P 500 showed RSI outperformed the market by 45%.
What is the best software for trading and testing RSI?
For our comprehensive RSI trading analysis, we leveraged TrendSpider, an industry-leading trading tool for backtesting and strategy development. As an expert, I found it to be an invaluable resource.
Which is better, RSI or moving averages?
RSI is better than all moving average indicators, based on 2,880 years of backtesting data. Our research indicates that RSI outperforms moving averages with a 53% win rate vs. the SMAs' 12%. Both indicators have poor success rates and are not recommended for traders on standard charts.
How to read the RSI chart?
To read RSI, look for oversold and overbought levels at 30 and 70, respectively. When the RSI crosses down through 70, it is a sell signal to traders; when it crosses up through 30, it is a buy signal.
What is the best software for trading RSI indicators?
TrendSpider is hands-down the top software for trading and backtesting RSI indicators; with point-and-click backtesting requiring no coding, it's a game-changer! TradingView is also good, offing pine code backtesting and global stock exchange, crypto, and forex coverage.
Is RSI the same as a moving average?
No, RSI is not the same as a moving average. There are four main moving averages; simple, exponential, weighted, and Hull. The RSI is an oscillating indicator with a different calculation and higher reliability.
Does RSI work?
Yes, RSI works very well, but only with a specific configuration using RSI-14 on a daily or hourly chart. This setup is tested to have a 53% success rate and outperforms the S&P 500 stocks by 45%. All other standard settings on OHLC/ candlestick charts are not profitable.
How accurate is RSI?
The RSI indicator is relatively accurate, especially with a standard OHLC, line, or candlestick chart. Our research indicates that RSI has a 53 percent win rate. Only the rate of change indicator on a Heikin Ashi chart is more effective at 66 percent.
How to make money trading RSIs?
To make money trading the RSI indicator, use a setting of 14 on an hourly or daily chart. This configuration will produce a 53% win rate. Conversely, that means a 47% chance you will not outperform a buy-and-hold strategy.
Is RSI effective for day trading?
No, RSI is not effective for day trading. Our test results on 1-minute charts show a low success rate of 20 percent, and a 5-minute chart had a 23 percent success rate.