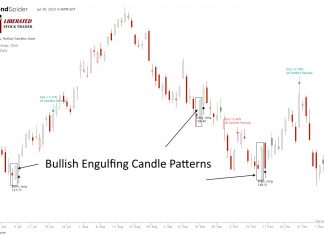
3,735 Bullish Engulfing Candle Trades Test its Reliability
Our research shows the Bullish Engulfing candle is not as bullish as most traders believe. Based on 568 years of data, it has a 55% success rate and an average win of 3.5%.
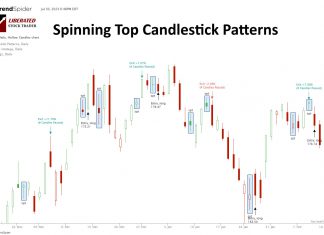
9,894 Trades Test a Spinning Top Candle Pattern’s Reliability
Our original research found that the Spinning Top candle is a bullish pattern, with a 55.9% success rate and a 3.7% average winning trade. Trading with a Spinning Top yields an average profit of 0.49%, ranking it the 10th best candle to trade.
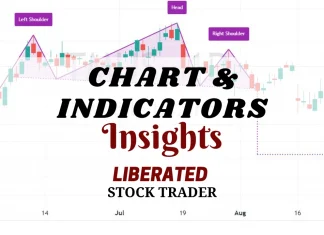
Money Flow Index (MFI) Explained: Best Settings & Reliability Tested
The Money Flow Index (MFI) is a momentum indicator in technical analysis that measures the in and outflows of money into a stock. It oscillates between 0 to 100 and is used to identify price reversals, market tops, and bottoms.
5 Steps to Choose the Best Technical Analysis Course
When selecting a technical analysis course, consider your preference for industry certification, certified instructors, or both. Also, think about the course duration and depth of content that best suits your needs. Lastly, check the training provider's returns policy for peace of mind.
Stock Market Trends: 6 Steps for Better Trend Analysis
All stock market trends can be described by using the following definitions. Market timeframes are short-term-medium-term, and long-term. Market direction is described using uptrend, downtrend, or consolidation.
How to Draw Trendlines on Stock Charts Like a Boss
Drawing trendlines on stock charts is a powerful way to assess the direction of the market. Trendlines help you understand the trend direction and timeframe to set expectations for future market moves.
Heikin-Ashi Candles Explained & Reliablility Tested
Our research shows that Heikin-Ashi charts are better than candlesticks for maximizing returns in trading strategies. We backtested 360 years of data across 30 major, and our findings prove that Heikin-Ashi chart strategies outperform 60% of equities vs. a buy-and-hold strategy.
How to Backtest Trading Strategies in 2024 with Examples & Tools
Experienced investors backtest their trading strategies to optimize their portfolios. Backtesting is a critical step that enables traders to assess the potential viability of a trading strategy by applying it to historical data.
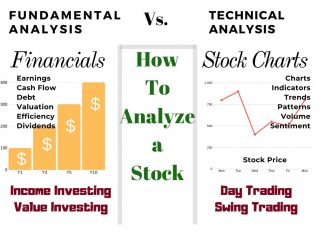
How To Analyze Stocks with Fundamental & Technical Analysis
There are two ways to analyze stocks. Fundamental analysis, which evaluates criteria such as PE ratio, earnings, and cash flow. Technical analysis, which involves studying charts, stock prices, volume, and indicators.
How to Identify & Avoid The Dead Cat Bounce
A dead cat bounce is a short-term asset price recovery after a significant volatile decline, followed by a continuation of the downtrend. Look for a short-lived rally that loses momentum quickly, often trapping bullish traders.
Linear vs. Logarithmic Charts Explained for Traders
Linear chart scales plot data at regular intervals, making it simple to see changes in data that have small fluctuations. Logarithmic chart scales represent percentage moves.
Price Action Trading: Mastering Day & Swing Trading Strategy
Price action trading is a method of day trading that relies on technical analysis but ignores conventional fundamental indicators, focusing instead on the movement of prices.
Our Best Training & Strategies
Liberated Stock Trader Pro: Learn Stock Market Investing
Learn stock market investing with the complete online stock trading course by Barry D. Moore, a certified financial analyst from the International Federation of Technical Analysts (IFTA).
ETF Investing Strategy: MOSES Improves Performance & Lowers Risk
The MOSES ETF investing strategy is a powerful suite of indicators meticulously backtested over 100 years. Designed to empower you to outperform the market, it equips you with the tools to navigate major stock market crashes and unlock greater investing performance.
Our LST Strategy Beat the Stock Market’s S&P 500 By 102%...
Decades of research and testing unveiled the Liberated Stock Trader Beat the Market System. Our 9-year, backtested, and proven strategy targets 35 financially healthy high-growth stocks, producing a track record of beating the S&P 500 by 102%.

