23 Best Stock Chart Patterns Proven Reliable By Data Testing
Published research shows the most reliable and profitable stock chart patterns are the inverse head and shoulders, double bottom, triple bottom, and descending triangle. Each has a proven success rate of over 85%, with an average gain of 43%.
How to Identify & Avoid The Dead Cat Bounce
A dead cat bounce is a short-term asset price recovery after a significant volatile decline, followed by a continuation of the downtrend. Look for a short-lived rally that loses momentum quickly, often trapping bullish traders.
9 Best Stock Chart Types For Traders & Investors Explained
Our research shows the most effective chart types for traders are Heikin Ashi, Candlestick, OHLC, Raindrop, and Renko charts. These charts provide the best balance of price and trend reversal information to help investors build effective trading strategies.
Ascending Triangle: Trade An 83% Successful Pattern
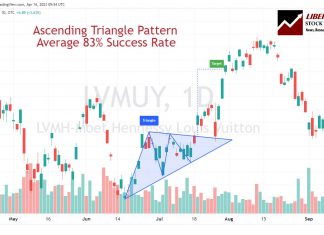
According to two decades of trading research, the ascending triangle pattern has an outstanding 83% success rate with an average potential profit of +43%. It's a well-known, reliable, accurate pattern that can generate good profits.
What are Market Profile Charts & Best Software To Use?
A market profile chart is a day-trading tool that displays the price activity to identify a time price opportunity (TPO). It helps traders identify the most traded prices and develop strategies to exploit these areas.
Linear vs. Logarithmic Charts Explained for Traders
Linear chart scales plot data at regular intervals, making it simple to see changes in data that have small fluctuations. Logarithmic chart scales represent percentage moves.
Fibonacci Retracement Trading Explained: I Test If It Works
In technical analysis, Fibonacci retracement is used by traders to predict levels of support and resistance by drawing horizontal lines according to the Fibonacci sequence. But Does It Work?
Tick Charts: Settings, Strategies & Examples Explained
Tick charts are uniquely constructed by plotting price movement after a certain number of transactions occur. Unlike traditional time-based OHLC or candlestick charts representing price action over a set period, tick charts update after a predefined trading volume is reached.
Renko Charts Trading Strategy: Best Settings Based On Data
Renko charts filter out unnecessary price fluctuations to provide a clear stock price trend that traders can use in their investing strategies. Unlike a traditional bar or candlestick chart, Renko charts are based on price changes rather than time.
Price Action Trading: Mastering Day & Swing Trading Strategy
Price action trading is a method of day trading that relies on technical analysis but ignores conventional fundamental indicators, focusing instead on the movement of prices.
How to Read Stock Charts Like a Boss: Beginners Guide +pdf
To read stock charts you need to use stock charting software, select your chart type, configure your timeframe, determine price direction using trendlines and use indicators to estimate future prices.
The Best Free Point & Figure Charts & How To Use...
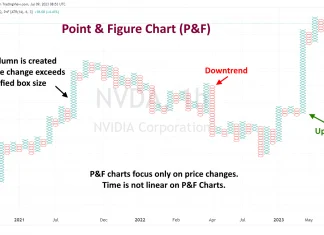
Point and Figure (P&F) charts are a unique form of technical analysis that focuses solely on price action, disregarding time and volume. They utilize 'Xs and 'Os to depict price movements, with 'X' representing an increase and 'O' a decrease.
Our Best Training & Strategies
Liberated Stock Trader Pro: Learn Stock Market Investing
Learn stock market investing with the complete online stock trading course by Barry D. Moore, a certified financial analyst from the International Federation of Technical Analysts (IFTA).
ETF Investing Strategy: MOSES Improves Performance & Lowers Risk
The MOSES ETF investing strategy is a powerful suite of indicators meticulously backtested over 100 years. Designed to empower you to outperform the market, it equips you with the tools to navigate major stock market crashes and unlock greater investing performance.
Our LST Strategy Beat the Stock Market’s S&P 500 By 102%...
Decades of research and testing unveiled the Liberated Stock Trader Beat the Market System. Our 9-year, backtested, and proven strategy targets 35 financially healthy high-growth stocks, producing a track record of beating the S&P 500 by 102%.

