Does Ichimoku Cloud Work? Success Rates & Settings Tested
Ichimoku Cloud, or "Ichimoku Kinko Hyo", is a moving average based chart indicator that visualizes the market's direction, momentum, and support/resistance levels.
ADX Indicator Best Settings & Trading Strategy Tested
According to our in-depth testing, an ADX(DMI + 14) setting crossing above 20 is a profitable buy signal, and crossing below 20 is a reliable sell signal. These settings resulted in an ADX 28% outperformance versus the S&P 500 stocks.
We Test Bullish & Bearish Marubozu Candles for Reliability
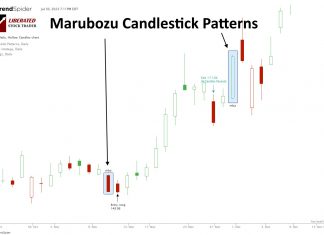
Our research shows Bearish Marubozu candles are among the most profitable patterns. Based on 568 years of data, it has a 56.1% success rate and an average win of 4.1%. Conversely, the Bullish Marubozu is one of the worst.
Dragonfly Doji Explained: Is it Reliable? I Test It!
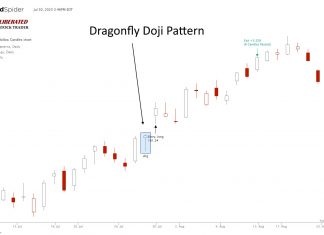
The Dragonfly Doji is a candlestick chart pattern that indicates an equilibrium between buyers and sellers after a day of trading volatility. Our 1,703 test trades prove it can be profitable under the right circumstances, but the margins are thin.
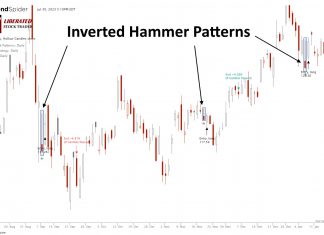
We Test the Inverted Hammer Candle Pattern! Is It Worth It?
Our research shows the Inverted Hammer is the most accurate and profitable candlestick pattern. Used as a bullish signal, it has a 60% success rate and an average win of 4.2%, based on 588 years of data.
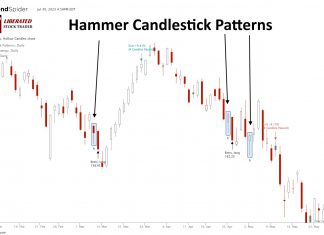
Hammer Candlesticks Patterns Explained & Reliability Tested
According to 2,219 tested trades, a Hammer is extremely unreliable and unprofitable. It has a low % accuracy rate of 52.1%, resulting in a razor-thin 0.18% profit per trade.
Mean Reversion Trading Strategy Explained with Examples
The mean reversion trading strategy suggests prices and returns eventually move back toward the mean or average. Reliable indicators like Stochastics, RSI, and Bollinger bands are based on mean reversion to identify overbought and oversold conditions.
Aroon Indicator Explained: Best Settings & Strategy Tested
In technical analysis, the Aroon indicator identifies trend reversals and trend strength. This oscillating indicator has two parts: the "Aroon Up" line measures uptrend strength, and the "Aroon Down" line for downtrend strength.
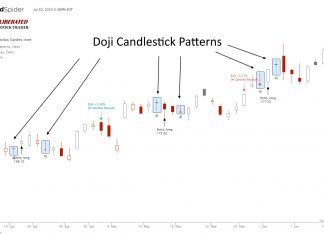
Trading a Doji Candle Explained: I Backtest It For Reliability!
A Doji candlestick chart pattern indicates a battle between buyers and sellers, ending in equilibrium. The Doji marks a potential trend reversal. Is the Doji pattern profitable or accurate? Our evidence suggests its profitability is marginal.
Reading & Trading Volume Profile Indicators Like a Pro
Volume profile technical analysis indicators provide a uniquely detailed overview of volume distribution across price levels, offering traders insights into market structure and supply and demand zones.
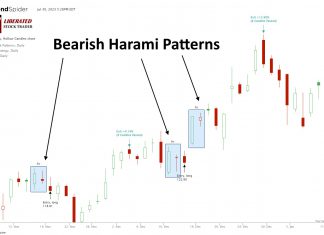
Bearish Harami Pattern: 5,624 Trades Tested for Reliability!
Our research shows Bearish Harami and Bearish Harami Cross are profitable patterns. Based on 1,136 years of data, the Bullish Harami has an average profit per trade of 0.48% and the Harami Cross 0.57%.
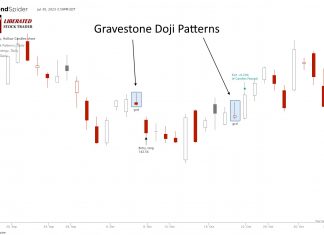
Gravestone Doji Explained & Reliability Tested!
A Gravestone Doji candle indicates a battle between buyers and sellers and is considered bearish. Our 1,553 test trades prove it is the third most profitable candle pattern. But it does not work as most traders believe.
How to Read Candlestick Charts Using 5 Reliable Patterns
You can read candlestick charts using pattern recognition software to identify five reliable patterns, the Inverted Hammer, Bearish Marubozu, Gravestone Doji, Bearish Engulfing, and Bullish Harami Cross.
How to Trade the DMI Indicator Profitably: 9,764 Trades Tested
Our testing, based on 9,764 trades over 25 years, proves the DMI indicator is profitable and reliable, outperforming the S&P 500 index.
Simple Moving Average Trading Settings & Strategy Tested
The simple moving average (SMA) technical analysis indicator helps identify stock price trends. It calculates an arithmetic average of prices, offering a smooth line that eliminates short-term price volatility.
ATR Indicator: Settings, Reliability & Usage Tested
The average true range (ATR) is a nondirectional momentum indicator that measures price volatility. Our 1,205 test trades showed a solid 1.77 reward-to-risk ratio with an average 8.5% winning trade.
Fibonacci Retracement Trading Tested! Does it Work?
In technical analysis, Fibonacci retracement is used by traders to predict levels of support and resistance by drawing horizontal lines according to the Fibonacci sequence. But Does It Work?
VWAP Indicator Best Settings & Strategy Based on 13,681 Trades
Using VWAP with a 14 setting on a daily Heikin Ashi chart is vastly superior to conventional OHLC charts. Using an OHLC chart, the strategy barely breaks even with a low-profit expectancy of 0.15. In contrast with a Heikin Ashi chart, the strategy is incredibly profitable, with a profit expectance of 0.83 and a reward-to-risk ratio of 3.03.
Is the Supertrend Indicator Super? 4,052 Test Trades Show How to...
Based on our extensive testing, it has been determined that when used as a standalone indicator, Supertrend does not demonstrate reliability or profitability. With an average profit expectancy of 0.24, it is recommended to combine Supertrend with other indicators.
23 Best Stock Chart Patterns Proven Reliable By Data Testing
Published research shows the most reliable and profitable stock chart patterns are the inverse head and shoulders, double bottom, triple bottom, and descending triangle. Each has a proven success rate of over 85%, with an average gain of 43%.


