How to Trade the Rising Wedge Pattern’s 81% Success Rate
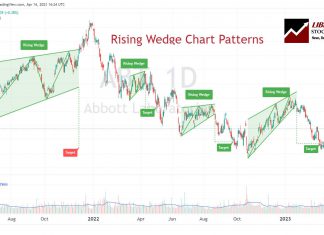
According to multi-year testing, the rising wedge pattern has a solid 81% success rate in bull markets with an average potential profit of +38%. The ascending wedge is a reliable, accurate pattern, and if used correctly, gives you an edge in trading.
Why Traders Must Avoid the Bear Pennant Pattern!
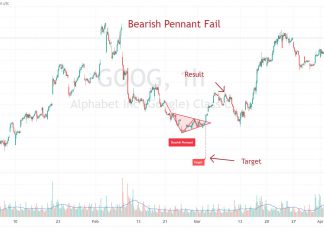
Traders should avoid using bear pennants. Decades of testing on over 1,600 trades show bearish pennants have a low success rate of 54% and a low price decrease of 6%.
How to Trade a Rectangle Pattern’s 85% Success Rate
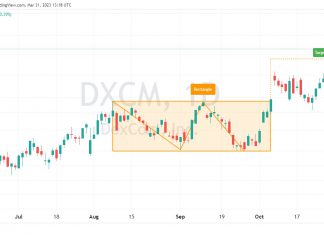
Decades of trading research show the rectangle pattern has an 85% success rate in bull markets and an average profit potential of +50%.
The Best Free Point & Figure Charts & How To Trade...
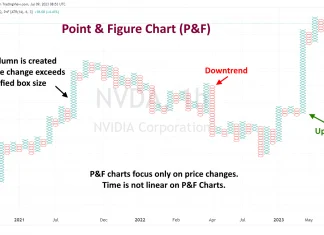
Point and Figure (P&F) charts are a unique form of technical analysis that focuses solely on price action, disregarding time and volume. They utilize 'Xs and 'Os to depict price movements, with 'X' representing an increase and 'O' a decrease.
Renko Charts Trading Strategy: Best Settings Based On Data
Renko charts filter out unnecessary price fluctuations to provide a clear stock price trend that traders can use in their investing strategies. Unlike a traditional bar or candlestick chart, Renko charts are based on price changes rather than time.
How to Trade a Double Bottom Pattern’s 88% Success Rate
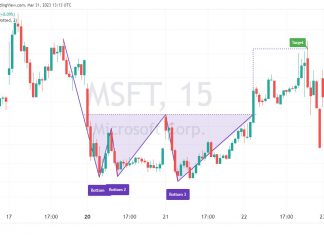
Decades of research reveal the double bottom pattern has an 88% success rate in bull markets and an average profit potential of +50%. The double-bottom chart pattern is one of the most reliable and accurate chart indicators in technical analysis.
Head & Shoulders Pattern: Trade an 81% Success Rate
The head and shoulders pattern is one of the most accurate technical analysis reversal patterns, with a reliability of 81%. A head and shoulders top occurs when the price peaks on three separate occasions, with two peaks forming the "shoulders" and the central peak forming the head.
Why Traders Should Avoid Using Bull Pennant Chart Patterns
Traders must be cautious when using bull pennant chart patterns. Published research reveals a low success rate of 54% and a meager price increase of 7%.
Optimal Tick Chart Settings, Strategies & TradingView Examples
Tick charts are uniquely constructed by plotting price movement after a certain number of transactions occur. Unlike traditional time-based OHLC or candlestick charts representing price action over a set period, tick charts update after a predefined trading volume is reached.
How to Trade a Falling Wedge’s 74% Chance of a 38%...
A falling wedge is a technical analysis pattern with a predictive accuracy of 74%. The pattern can break out up or down but is primarily considered bullish, rising 68% of the time.
How to Trade a Triple Bottom Pattern’s 87% Success Rate
Decades of trading research show the triple-bottom pattern has an 87% success rate in bull markets and an average profit potential of +45%. The triple bottom chart pattern is popular because it is reliable and accurate and generates a good average profit for traders.
How to Trade an Ascending Triangle Pattern’s 83% Success Rate!
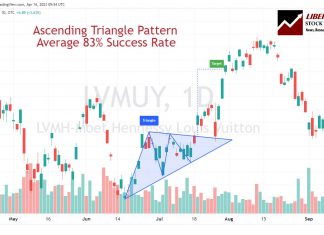
According to two decades of trading research, the ascending triangle pattern has an outstanding 83% success rate with an average potential profit of +43%. It's a well-known, reliable, accurate pattern that can generate good profits.
How to Trade the McClellan Oscillator Effectively
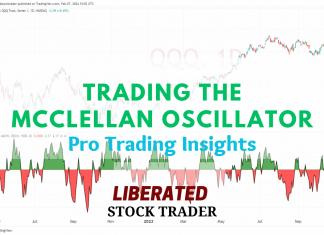
The McClellan Oscillator is a technical analysis tool designed to assess the market breadth of the New York Stock Exchange (NYSE). It is renowned for its effectiveness in revealing the underlying strength or weakness of the market by comparing the number of advancing to declining stocks.
Elliott Wave Theory: Usage, Rules & Reliability Tested
Elliott Wave Theory is a scientifically unproven technical analysis indicator used to attempt to predict price movements in financial markets. I highly recommend avoiding this indicator.
Weighted Moving Average (WMA) Explained & Reliability Tested
Our research reveals the WMA underperforms other moving averages with only a 7% win rate on a standard OHLC chart. However, using it on Heikin Ashi charts produces excellent results.
How to Trade Pivot Points in Stocks Based on 66,480 Trades
Traders utilize pivot point indicators to predict when stock prices will reverse direction. But does it work? I tested 66,480 trades on 210 years of data, and the results are surprising.
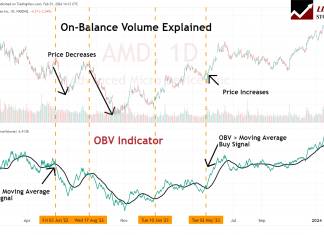
OBV Indicator: Best Settings & Trading Strategy Explained
On-balance volume (OBV) is a cumulative indicator in technical analysis designed to show the volume flow relative to a security's price movements. The OBV reflects the collective buying and selling pressure crystallized through the volume trend.
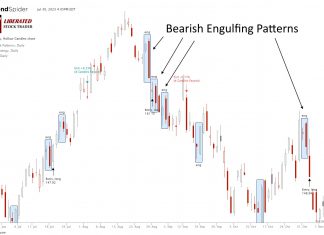
Bearish Engulfing Candles Explained & Reliability Tested
Our research shows the Bearish Engulfing candle is an accurate and profitable pattern. Our 568 years of data reveals a 57% success rate and an average win of 3.7%.
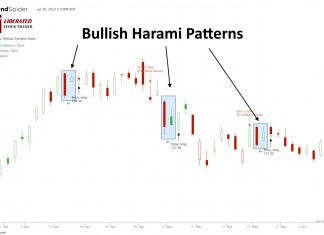
Are Bullish Harami Candles Profitable? We Test It?
Our research shows Bullish Harami and Bullish Harami Cross are profitable patterns. Based on 1,112 years of data, the bullish Harami has an average profit per trade of 0.5% and the Harami Cross 0.58%.
RSI Indicator Explained: Best Settings & Strategy Tested
The Relative Strength Index (RSI) is an oscillating momentum indicator that measures the speed and change of stock price movements. RSI uses a scale from 0 to 100 to indicate overbought or oversold conditions.


