12 Ways to Master Stock Chart Indicators by a Certified Analyst
Professional market analysts build trading strategies using chart indicator techniques like divergences, multi-time frame analysis, indicator combinations, and rigorous backtesting.
Is the S&P 500 200-Day Moving Average Profitable? I Test It!
Our testing of the 200-day MA on the S&P500 over 16 years revealed that using this indicator is a losing proposition. A buy-and-hold strategy made a profit of 192% vs. the 200-day MA, which made only 152%.
Best Commodity Channel Index (CCI) Settings Tested on 43,297 Trades
Our test data shows that using the CCI indicator with a 50 setting on the S&P 500 index stocks over 20 years was incredibly profitable, returning a 1,108% profit compared to the market, which returned 555%.
Top 10 Reliable Candle Patterns: 56,680 Trades Tested
Our 56,680 test trades show the most reliable candlestick formations are the Inverted Hammer (60% success rate), Bearish Marubozu (56.1%), Gravestone Doji (57%), and Bearish Engulfing (57%).
Stochastic Oscillator Explained: Best Strategy & Settings Tested
The Stochastic Oscillator momentum indicator compares an asset's closing price to a range of its previous prices. It oscillates between 0 and 100; below 20 indicates oversold, and above 80 suggests an overbought market.
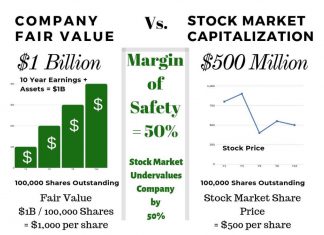
How to Calculate Warren Buffett’s Margin of Safety: Formula + Excel
Calculating Buffett's margin of safety formula requires understanding cash flow, discounting, and intrinsic value.
8 Steps to Build a Balanced & Profitable Portfolio
To build a balanced investment portfolio, determine how much to invest, your risk tolerance, portfolio allocation, and your investing strategy. Next, choose the right tools to screen and research the ideal stocks and ETFs to enable you to manage your portfolio effectively.
11 Real-World Investment Scams to Avoid in 2024
Investment scammers defrauded $8.8 billion from unsuspecting consumers in 2022, a staggering 30% year-on-year surge. Don't fall victim to NFT, Crypto, Forex, Ponzi, or offshore scams.
Simple Moving Average Trading: Settings & Strategy Tested
The simple moving average (SMA) technical analysis indicator helps identify stock price trends. It calculates an arithmetic average of prices, offering a smooth line that eliminates short-term price volatility.
How to Day Trade and Is It Worth It? Tools &...
Ultimately, for 95% of speculators, day trading is not worth it. Although day traders can make significant money quickly, statistics show that most day traders lose money. Over a six-month period excessive commissions, poor trading decisions, weak strategies, and bad market timing cause losses.
A Historical Analysis of the 1929 Stock Market Crash
The 1929 stock market crash was caused by an equities bubble fueled by lax monetary policy and easy access to credit. People believed the...
Do Tweezer Top & Bottom Candle Patterns Work? I Test It!
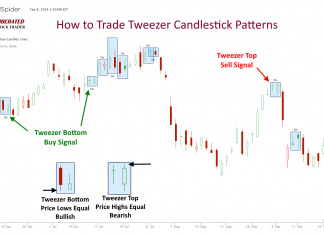
Based on our testing of 1,892 trades, the tweezer top and bottom patterns are highly unreliable and unprofitable. These patterns exhibit a reward-to-risk ratio of only 1.07, with 50% of trades resulting in losses. Relying on tweezers as a trading strategy yields poor results.
Wyckoff Method Explained: Accumulation & Distribution Trading
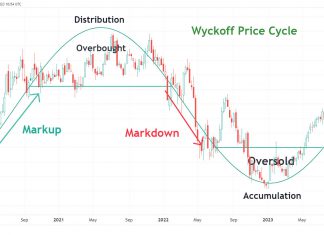
The Wyckoff Method is built upon three cardinal laws that govern the financial markets: the Law of Supply and Demand, the Law of Cause and Effect, and the Law of Effort versus Result.
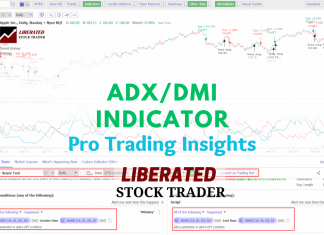
How to Trade the DMI Indicator Profitably: 9,764 Trades Tested
Our testing, based on 9,764 trades over 25 years, proves the DMI indicator is profitable and reliable, outperforming the S&P 500 index.
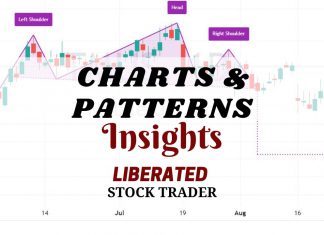
12 Accurate Chart Patterns Proven Profitable & Reliable
Research shows the most reliable chart patterns are the Head and Shoulders, with an 89% success rate, the Double Bottom (88%), and the Triple Bottom and Descending Triangle (87%). The Rectangle Top is the most profitable, with a 51% average win.
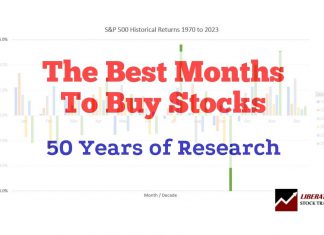
The Best Month to Buy Stocks: 53 Years of Analysis
According to our research, using 53 years of stock exchange data, the best time to buy stocks is in October, and the best time to sell stocks is in July.
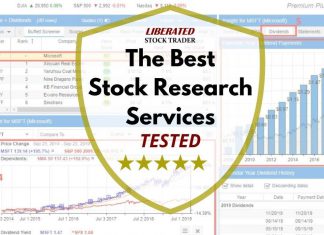
7 Best Stock Picking & Advisory Services 2024
Our stock advisor review and tests show the best stock picking services are Motley Fool Stock Advisor, Morningstar, AAII, and Zacks. Stock Rover is the best stock research tool as an alternative to stock picking services.
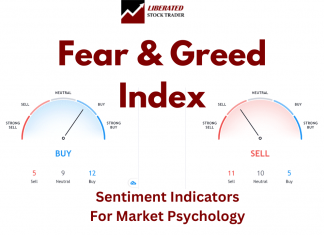
Fear & Greed Index: 10 Stock Sentiment Charts
Our live fear and greed index charts enable you to see the sentiment of investors, the turning points between bull and bear stock markets, and know when to buy and sell stocks.
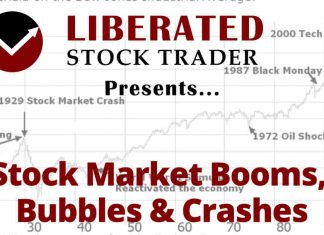
Stock Market Crashes: History, Cause, Effect & Fixes
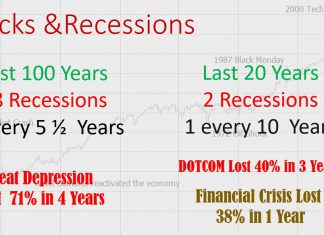
The 1929 crash was the worst of all, declining 89% in 3 years and taking 23 years to recover fully. The quickest, most severe crash was in 2000, dropping 38% in 30 days, followed by 1987 with -35% in a single month.
Master Technical Analysis: A 14-Video Ultimate Guide
Our ultimate guide to technical analysis will fast-track your knowledge with our 14 videos covering charts, trends, indicators, patterns, and tools.
Our Best Training & Strategies
Liberated Stock Trader Pro: Learn Stock Market Investing
Learn stock market investing with the complete online stock trading course by Barry D. Moore, a certified financial analyst from the International Federation of Technical Analysts (IFTA).
ETF Investing Strategy: MOSES Improves Performance & Lowers Risk
The MOSES ETF investing strategy is a powerful suite of indicators meticulously backtested over 100 years. Designed to empower you to outperform the market, it equips you with the tools to navigate major stock market crashes and unlock greater investing performance.
Our LST Strategy Beat the Stock Market’s S&P 500 By 102%...
Decades of research and testing unveiled the Liberated Stock Trader Beat the Market System. Our 9-year, backtested, and proven strategy targets 35 financially healthy high-growth stocks, producing a track record of beating the S&P 500 by 102%.
TradingView Review 2024: Tested by LiberatedStockTrader
LiberatedStockTrader's review testing awards TradingView 4.8 stars due to excellent stock chart analysis, pattern recognition, screening, and backtesting. TradingView is our top recommendation for US and international traders.
Stock Rover Review 2024: Tested by LiberatedStockTrader
LiberatedStockTrader's review testing awards Stock Rover 4.7 stars. Its advanced screening, research, and portfolio tools are ideal for US value, income, and growth investors. With 650 financial metrics on 10,000 stocks and 44,000 ETFs, we rate Stock Rover the number one stock screener.
Trade Ideas Review 2024: AI Tested by LiberatedStockTrader
Our in-depth testing shows Trade Ideas is the ultimate black box AI-powered day trading signal platform with built-in automated bot trading. Three automated Holly AI systems pinpoint trading signals for day traders.
TrendSpider Review: Big 2024 Updates! Is It Now The Best?
Our TrendSpider testing finds it is ideal for US traders wanting AI-automated charting, pattern recognition, and backtesting of stocks, indices, futures, and currencies.
Benzinga Pro Review 2024: Tested by LiberatedStockTrader
Our testing shows Benzinga Pro is best for US traders who want a high-speed, actionable, real-time news feed at 1/10th of the price of a Bloomberg terminal. I recommended Benzinga Pro for active day traders and investors who trade news events.
MetaStock Review 2024: Tested by LiberatedStockTrader
Our MetaStock review and test reveal an excellent platform for traders, with 300+ charts and indicators for stocks, ETFs, bonds & forex globally. Metastock has solid backtesting and forecasting, and Refinitiv/Xenith provides powerful real-time news and screening.

