Stochastic Oscillator Explained: Best Strategy & Settings Tested
The Stochastic Oscillator momentum indicator compares an asset's closing price to a range of its previous prices. It oscillates between 0 and 100; below 20 indicates oversold, and above 80 suggests an overbought market.
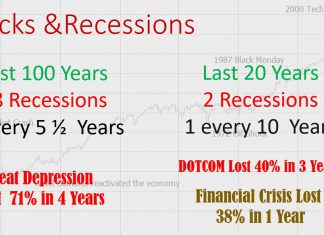
A Historical Analysis of the 1929 Stock Market Crash
The 1929 stock market crash was caused by an equities bubble fueled by lax monetary policy and easy access to credit.
People believed the US...
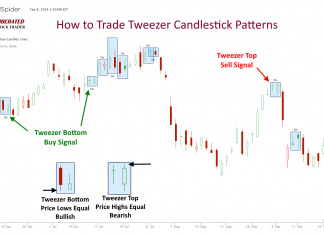
Do Tweezer Top & Bottom Candle Patterns Work? I Test It!
Based on our testing of 1,892 trades, the tweezer top and bottom patterns are highly unreliable and unprofitable. These patterns exhibit a reward-to-risk ratio of only 1.07, with 50% of trades resulting in losses. Relying on tweezers as a trading strategy yields poor results.
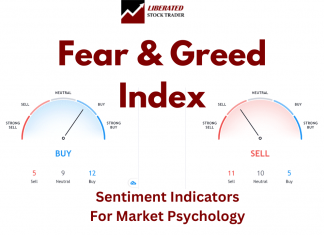
Fear & Greed Index: 10 Stock Sentiment Charts
Our live fear and greed index charts enable you to see the sentiment of investors, the turning points between bull and bear stock markets, and know when to buy and sell stocks.
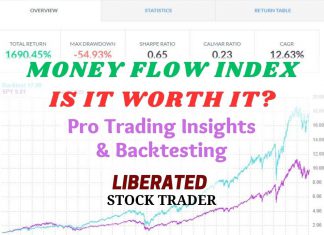
Money Flow Index (MFI) Explained: Best Settings & Reliability Tested
The Money Flow Index (MFI) is a momentum indicator in technical analysis that measures the in and outflows of money into a stock. It oscillates between 0 to 100 and is used to identify price reversals, market tops, and bottoms.
Stock Order Types: Using Market, Limit & Trailing Stops in Trading
Limit, market, and stop limit orders, help ensure you get the best possible stock purchase price. Stop limit, stop market, and trailing stop orders help sell your stocks for profit or limit your risk.
Day & Swing Trading vs. Growth & Value Investing Explained.
Day and swing trading uses technical chart analysis to trade short-term price moves, whereas growth and value investing use long-term fundamental financial analysis. The tools and strategies used for these types of trading are completely different.
How to Research Stocks to Find the Hidden Gems
To research stocks, investors need to use trustworthy research tools and reports to find good investments. The ability to understand the research and hone an investing strategy is paramount.
How to Backtest Trading Strategies in 2024 with Examples & Tools
Experienced investors backtest their trading strategies to optimize their portfolios. Backtesting is a critical step that enables traders to assess the potential viability of a trading strategy by applying it to historical data.
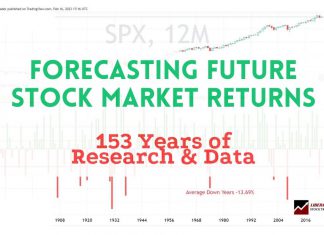
Forecasting Stock Market Returns with 154 Years of Data Analysis
154 years of S&P 500 stock research data from 1871 to 2024 forecasts a 90% chance that the next ten years will be profitable, averaging 6.2% profit per year. The average positive gains year will be 16.54%, and the average negative year will be 13.69%.
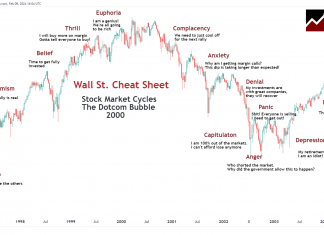
Wall Street Cheat Sheet: Master Your Mind & Market Psychology
The Wall Street Cheat Sheet is a roadmap for navigating the emotional highs and lows investors face during market cycles. Each phase reflects a collective sentiment that can influence financial markets and, subsequently, the price movement of stocks.
Linear vs. Logarithmic Charts Explained for Traders
Linear chart scales plot data at regular intervals, making it simple to see changes in data that have small fluctuations. Logarithmic chart scales represent percentage moves.
Quad Witching Explained: Trading Volatility & Volume
Quadruple Witching refers to the concurrent expiration of four derivatives: stock index futures, stock index options, stock options, and single stock futures. It occurs quarterly, on the third Friday of March, June, September, and December, bringing unique opportunities for traders.
Our 4 Best Stock Investment Courses In One All-Star Pass
Our 4 Best Stock Investment Courses In One All-Star Pass. Start 2024 The Right Way with Full Lifetime Access To Our Pro Stock Investment Courses & Market-Beating Strategies.
Trading Parabolic Stocks: Definition & Examples
Parabolic stocks are defined by a rapid and steep uptrend in price, increased volume, and limited price pullbacks. These moves are typically short-lived, with prices skyrocketing and quickly reversing course.
Buy the Rumor, Sell the News Explained with Examples
The adage "buy the rumor, sell the news" is a contrarian trading strategy predicated on anticipating market reactions to rumors and news announcements.
Scalping Trading Strategy, Tools & Techniques Explained
Scalping trading is a fast-paced strategy focusing on achieving profits from small price changes in the securities market. Traders who utilize scalp trading are known as scalpers, and they aim for a high volume of trades that individually yield small gains.
Santa Claus Rally Explained: Is it Real? We Test It!
According to our data, the Santa Rally is a real occurrence. Our evidence shows mean stock price increases in October +1.74%, November +2.40%, and December +0.56%. Weekly evidence shows week 52 is the strongest, with 68% increasing an average of 0.86%.
Price Action Trading: Mastering Day & Swing Trading Strategy
Price action trading is a method of day trading that relies on technical analysis but ignores conventional fundamental indicators, focusing instead on the movement of prices.
Leading Indicators: Super-Charging Your Investing Strategy
Leading indicators are predictive signals that forecast future economic activity and market trends, allowing investors to anticipate changes before they occur.
Our Best Training & Strategies
Liberated Stock Trader Pro: Learn Stock Market Investing
Learn stock market investing with the complete online stock trading course by Barry D. Moore, a certified financial analyst from the International Federation of Technical Analysts (IFTA).
ETF Investing Strategy: MOSES Improves Performance & Lowers Risk
The MOSES ETF investing strategy is a powerful suite of indicators meticulously backtested over 100 years. Designed to empower you to outperform the market, it equips you with the tools to navigate major stock market crashes and unlock greater investing performance.
LiberatedStockTrader’s Strategy Beat the Market By 102%
Decades of research and testing unveiled the Liberated Stock Trader Beat the Market System. Our 9-year, backtested, and proven strategy targets 35 financially healthy high-growth stocks, producing a track record of beating the S&P 500 by 102%.
TradingView Review 2024: Tested by LiberatedStockTrader
LiberatedStockTrader's review testing awards TradingView 4.8 stars due to excellent stock chart analysis, pattern recognition, screening, and backtesting. TradingView is our top recommendation for US and international traders.
Stock Rover Review 2024: Tested by LiberatedStockTrader
LiberatedStockTrader's review testing awards Stock Rover 4.7 stars. Its advanced screening, research, and portfolio tools are ideal for US value, income, and growth investors. With 650 financial metrics on 10,000 stocks and 44,000 ETFs, we rate Stock Rover the number one stock screener.
Trade Ideas Review 2024: AI Tested by LiberatedStockTrader
LiberatedStockTrader's review testing awards Trade Ideas 4.7 stars. Its stock scanner and proven Holly AI algorithms are the most advanced and trustworthy auto-trading software for day traders.
TrendSpider Review: Big 2024 Updates! Is It Now The Best?
Our TrendSpider testing finds it is ideal for US traders wanting AI-automated charting, pattern recognition, and backtesting of stocks, indices, futures, and currencies.
Benzinga Pro Real-time News Tested by LiberatedStockTrader
Our testing shows Benzinga Pro is best for US traders who want a high-speed, actionable, real-time news feed at 1/10th of the price of a Bloomberg terminal. I recommended Benzinga Pro for active day traders and investors who trade news events.
MetaStock Review 2024: Tested by LiberatedStockTrader
Our MetaStock review and test reveal an excellent platform for traders, with 300+ charts and indicators for stocks, ETFs, bonds & forex globally. Metastock has solid backtesting and forecasting, and Refinitiv/Xenith provides powerful real-time news and screening.


