Sell Signals In Stock Trading: How I Identify, Evaluate, and Act
A sell signal gives traders a heads-up on when to consider closing positions, helping them lock in gains or cut losses using actual triggers, not just hunches.
7 Epic AI Stock Trading Tools & Bots Fully Tested 2025
My research identifies Trade Ideas and TrendSpider as the leaders in AI trading software. Trade Ideas offers automated trading and bots, while TrendSpider offers automated pattern recognition, auto-trading, and backtesting.
Beyond SpaceX Stock: 3 Cutting-Edge Space Investments
SpaceX stock is not available to buy on any listed stock exchange because it is a privately held company, and the majority stakeholder is Elon Musk. Musk has raised $10.5 billion in private equity capital from 10 companies.
8 Step Guide: I Start an Algo Trading System From Scratch
To create an algo trading system, I recommend choosing a strategy, selecting a trading platform, choosing the asset type, selecting the indicators and patterns, backtesting, and refining the strategy.
How I Find and Act On Buy Signals In Stock Trading
A buy signal is essentially an indicator or event that suggests it may be a good time to purchase a particular stock, whether based on technical data, chart patterns, or intrinsic value.
Unveiling the Secret Japanese Trading Tactics of Kagi Charts
Kagi charts provide traders with a unique perspective on price action, filtering out much of the noise and highlighting genuine trends.
Getting a handle on how to use Kagi charts, dialing in the right settings, and understanding how they compare to other chart types can really sharpen your technical analysis and trading decisions.
The Truth About AI Trading & The Strategies & Tools to...
Most AI trading tools do not use real AI machine learning and large language models. The majority of self-proclaimed AI trading tools are algorithmic and do not actually learn.
How to Identify & Trade Seasonal Trends in Financial Markets
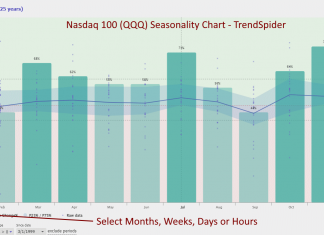
Seasonal trends refer to certain sectors, like retail, which often perform better during holiday seasons, while agricultural products might see spikes during harvest times.
Video: Stock Rover In-Depth Test & Review – For Serious Investors...
After extensive testing, I’ve rated Stock Rover 4.7 stars. With its advanced screening, research capabilities, and portfolio management tools, it’s a perfect choice for US value, income, and growth investors.
Insider Trading: How to Find, Analyze & Profit From It
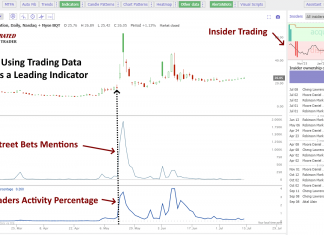
Legal insider trading happens when corporate insiders trade their own company's stock following SEC reporting rules. Illegal insider trading, in contrast, involves trading a public company's stock based on nonpublic, material information.
Video: TradingView Review & Test – The Ultimate All-Rounder
After years of testing, I’m giving TradingView an impressive 4.8 stars for its cutting-edge innovation in chart analysis, pattern recognition, screening, and backtesting. It’s hands-down my top pick for both US and international traders.
Study: Musk’s Popularity Drops 14% While Tesla Sales Fall
The study reveals that while Musk and Tesla enjoyed a boost in public perception following Donald Trump’s 2024 re-election, that goodwill has since eroded. The reason? Musk's interference in foreign elections and controversial role in DOGE is killing the brand.
Welcome to the New Stock Market Reality Uncle Sam!
I decided to liquidate all U.S. holdings after carefully evaluating the fundamental outlook and market sentiment using the Liberated Stock Trader Fear and Greed Index.
12 Chart Patterns Proven Profitable
Believe it or not, certain chart price patterns are genuinely effective. While not every pattern is reliable, a select few have consistently proven their worth over time.
Cup & Handle Pattern Video: An Incredibly Reliable Pattern
Two decades of trading research indicate that the cup and handle pattern boasts a 95% success rate in bull markets, yielding an average profit of +54%
Double Bottom Pattern Video: One of the Best Strategies
Decades of research show that the double bottom pattern boasts an 88% success rate in bull markets and offers an average profit potential of +50%.
Inverse Cup & Handle Pattern Video: Highly Profitable
Research spanning two decades shows that the inverse cup and handle pattern boasts an 82% success rate, often resulting in average price declines of 17%. This makes it an excellent pattern for short-selling strategies.
Charts For Traders Video: Which Charts Should You Use?
My research indicates that the most effective chart types for traders are Heikin Ashi, Candlestick, OHLC, Raindrop, and Renko charts. These charts offer an optimal balance of price and trend reversal information, aiding investors in developing successful trading strategies.
Accurate Day Trading Indicators Video: Fully Tested
Our extensive research, spanning 10,400 years of exchange data, reveals that the top day trading indicators are the Price Rate of Change, VWAP, Weighted Moving Average, Hull Moving Average, Simple Moving Average, and RSI.
Heikin-Ashi Video: A Better Way to Use Stock Charts
Through extensive research, I have found that Heikin-Ashi charts surpass traditional candlesticks in maximizing returns for trading strategies. After backtesting 360 years of data across the 30 most significant US stocks, our findings reveal that Heikin-Ashi chart strategies outperform a buy-and-hold approach in 66% of equities.


