On-balance volume (OBV) is a technical analysis momentum chart indicator. It cumulatively plots volume flows, giving traders insights into how much conviction lies behind a price trend and whether that trend will continue or reverse.
The concept behind OBV is simple: when volume increases, it suggests that price movements are more significant and will likely continue in the same direction.
Conversely, if volume decreases while prices are rising, it may signal weakness in the trend and an upcoming reversal. As such, OBV can be used to confirm price trends or identify potential trend changes.
I have been using OBV for many years and can show you how to effectively use it in your trading strategy.
Key Takeaways
- OBV combines price movement and volume to show market trend conviction.
- Cumulative volume flow aids in market trend analysis and decision-making.
- The direction of the OBV line can suggest bullish or bearish market sentiment before the actual price moves.
- Divergences between OBV and price trends may indicate potential price reversals.
OBV considers the total volume of trading and adds or subtracts the volume on days when the price moves up or down. It operates under the premise that volume precedes price movements, implying that a volume change can predict future changes in stock prices.
Understanding OBV
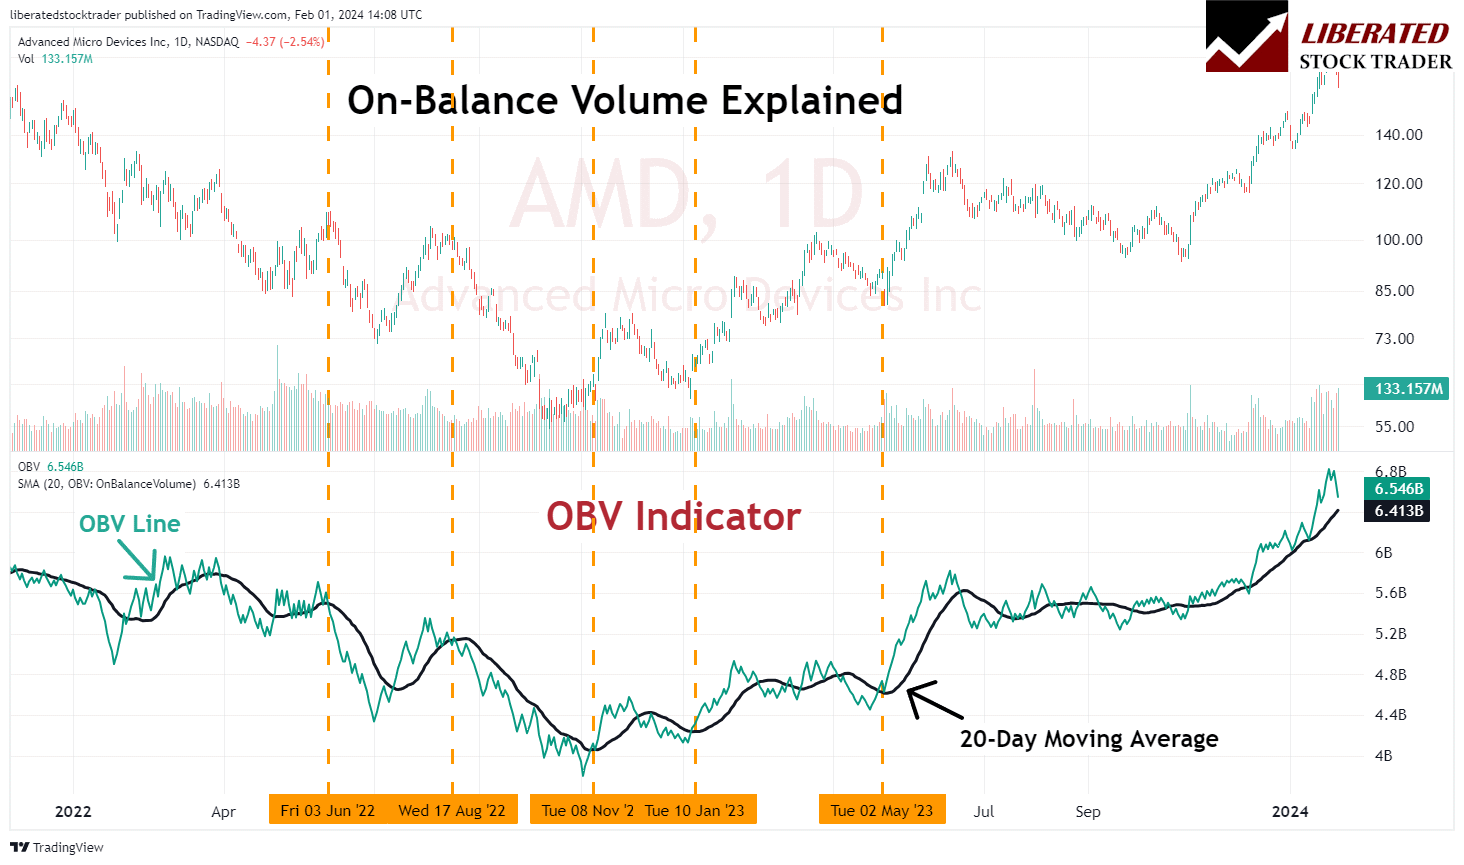
On-balance volume (OBV) is a cumulative indicator in technical analysis designed to show the volume flow relative to a security’s price movements. The OBV reflects the collective buying and selling pressure crystallized through the volume trend.
An upward OBV line suggests net buying pressure, which can predict a price increase. Conversely, a downward OBV indicates net selling pressure, potentially signifying a price decline.
Analysts often use OBV to confirm trends or to anticipate reversals when the price movement doesn’t align with the OBV.
Try the OBV Indicator on TradingView
When you use OBV, you consider an increase in volume a signal that sharp price movements may follow. If a security closes higher than the previous day, volume is added to the indicator, representing buyers’ accumulation. Conversely, if it closes lower, volume is subtracted, implying sellers’ distribution.
The calculation of OBV is straightforward:
- If today’s closing price is higher than yesterday’s, today’s volume is added to the OBV.
- If today’s closing price is lower than yesterday’s, today’s volume is subtracted from the OBV.
- If today’s closing price equals yesterday’s, the OBV does not change.
The key implications of OBV to understand are:
- A rising OBV reflects positive volume pressure that can lead to higher prices.
- A falling OBV indicates negative volume pressure that can lead to lower prices.
- If OBV does not confirm price movements, it suggests a potential price reversal.
Traders often use OBV to confirm the trend or to anticipate potential reversals. For instance, if a price is making new highs but OBV is not, you might question the price trend’s sustainability.
My thorough testing awarded TradingView a stellar 4.8 stars!
With powerful stock chart analysis, pattern recognition, screening, backtesting, and a 20+ million user community, it’s a game-changer for traders.

Whether you're trading in the US or internationally, TradingView is my top pick for its unmatched features and ease of use.
Explore TradingView – Your Gateway to Smarter Trading!
Volume and Price Dynamics
In the interplay of the stock market, volume is as pivotal as price—your comprehension of how the two correlate will enhance your market analysis capabilities.
Components of Volume
Volume represents the number of shares traded in a stock within a specific period. The key volume component is the daily trading volume, the total count of shares traded during a day. When you observe high volume, it signifies a high level of interest in the stock.
- Up Days: These are days when the stock closes higher than it opened, typically suggesting buying interest.
- Down Days: Conversely, these are days when the stock closes lower than it opened, often indicating selling pressure.
Tracking the number of up versus down days helps you grasp the market sentiment.
Price and Volume Relationship
The correlation between price and volume can indicate the strength or weakness of a price trend. A high-volume price increase may denote strong buyer interest and a possible continuation of the trend. In contrast, if the price increases but the volume is low, the upward move might be less reliable.
- Upsurge in Price & Volume: This combination often suggests a strong position where the stock price will likely continue to climb.
- Increase in Price but Decrease in Volume: Be wary, as this might signal a weak move, with a potential reversal on the cards.
Volume Flow
The concept of volume flow refers to the cumulative total of up and down volume over time. This flow helps you understand whether money flows into or out of a stock.
- Positive Volume Flow: More volume on up days than down days implies stock accumulation.
- Negative Volume Flow: Greater volume on down days, hinting at distribution or selling off of the stock.
By monitoring the volume flow, you can better predict the future movement of the stock price, improving your decision-making in the market.
Calculating the On-Balance Volume
The On-Balance Volume (OBV) uses volume flow to predict changes in stock price. The core assumption behind OBV is that volume precedes price movement, making it a useful tool for identifying trends.
OBV Formula
Your OBV is calculated by taking a cumulative total of the security’s trading volume. It increases (or decreases) by the day’s total volume if the closing price is higher (or lower) than the previous closing price. Here’s the formula you’ll use:
Current OBV = Previous OBV ± Today’s Volume
- If today’s closing price is higher than yesterday’s closing price, then:
- Current OBV = Previous OBV + today’s volume
- If today’s closing price is lower than yesterday’s closing price, then:
- Current OBV = Previous OBV – Today’s volume
- If today’s closing price is the same as yesterday’s closing price, then:
- Current OBV = Previous OBV
Here is a visual representation:
| Closing Price Comparison to Previous Day | OBV Calculation |
|---|---|
| Higher | OBV = Previous OBV + Current Volume |
| Lower | OBV = Previous OBV – Current Volume |
| Unchanged | OBV = Previous OBV |
This indicator is meant to establish a cumulative total of volume that adds or subtracts each day’s volume based on the direction of the price move, giving you insight into how volume might influence price trends.
Interpreting OBV Values
Interpreting OBV involves looking at its trend in relation to the price. An increasing OBV indicates that the volume confirms an uptrend and buyer accumulation, suggesting a positive sentiment in the market. Conversely, a decreasing OBV signifies that the volume confirms a downtrend due to distribution and signals negative sentiment.
Positive and Negative Volume
Volume can be classified as positive when the closing price increases from the previous close, implying accumulation. Negative volume occurs when the closing price decreases from the previous close, implying distribution. Your interpretation of OBV depends on understanding the difference between days categorized by positive volume (which adds to the OBV) and those by negative volume (which subtracts from the OBV), which helps identify whether buyers or sellers are in control of the market momentum.
Identifying Market Trends
The OBV indicator is essential in identifying and confirming overall market trends. By analyzing the volume flow, you can gauge the strength of a trend based on the conviction of buyers and sellers.
Try the OBV Indicator on TradingView
Trends and OBV
The OBV relates price trends to volume, suggesting that volume precedes price movements. An uptrend is typically confirmed when the OBV moves in tandem with the price trend, showing buying pressure. If the OBV rises, it indicates robust volume to support a price increase, signaling an uptrend. Conversely, a downtrend is seen when the OBV declines, suggesting selling pressure and support for a price decrease.
Distinguishing Uptrend and Downtrend
To distinguish between an uptrend and a downtrend using OBV, you should observe the direction of the OBV line in relation to price movements. An uptrend is often characterized by higher highs in both price and OBV, while lower lows identify a downtrend. Here’s a simple way to recognize the trend:
- Uptrend: Both price and OBV are making higher highs.
- Downtrend: Both price and OBV are making lower lows.
OBV Convergence and Divergence
Convergence occurs when the OBV mirrors price trends, reinforcing the current price movement’s momentum. This can offer you confidence in the trend’s direction. Divergence, on the other hand, takes place when the OBV trend differs from the price trend. This can serve as a warning:
- Bullish Divergence: Price hits lower lows, OBV does not.
- Bearish Divergence: Price hits higher highs, OBV does not.
Divergences between price trends and OBV can be early indicators for potential reversals in the market’s direction. Ensure you adjust your strategies accordingly when such divergences are observed.
On-Balance Volume Trading
OBV is a momentum indicator that uses volume flow to predict changes in stock price. The main premise is that OBV changes precede price changes. As a trader, integrating OBV into your strategy can provide a different dimension to your market analysis.
OBV in Entry and Exit Strategy
Utilize OBV to refine your entry and exit points. When the OBV moves in the same direction as the price trend, it confirms the strength of the trend. Conversely, if the OBV starts to diverge, it can signal potential trend weakness or reversal. Entry should be considered when the OBV trends upward, indicating buying pressure. Prepare your exit as the OBV trends downward, suggesting selling pressure or reduced interest in the asset.
Support, Resistance, and OBV
OBV can enhance your understanding of support and resistance levels. A rising OBV may imply impending upward breakouts through resistance levels, guiding you to anticipate potential entry opportunities. If the OBV starts to flatline or descend as the price approaches a support level, this could indicate that the support might hold strong, prompting a potential buying decision.
OBV for Intraday Trading
For intraday trading, OBV can signal short-term momentum shifts within a trading range. Monitor OBV trends in relation to the asset’s price: a rising OBV combined with a stable price may suggest a forthcoming price increase. An OBV decline within a stable price range could hint at an upcoming price decrease. Utilize this information to make timely intraday trading decisions.
Advanced OBV Analysis
In advanced OBV analysis, you focus on specific patterns like breakouts and breakdowns, compare OBV trends with other securities, and integrate momentum oscillators to enhance the accuracy of predictions.
OBV Breakouts and Breakdowns
A breakout in OBV occurs when the On-Balance Volume indicator moves out of a predefined range, suggesting a strong buying pressure that could precede an uptrend. Conversely, an OBV breakdown indicates significant selling pressure, often a precursor to a downturn. Watch for the slope of the OBV line; a steep slope on increased volume can confirm the strength of a rally or a sell-off.
Comparative Analysis with OBV
Comparing the OBV of one security with another or with a market index can be insightful. If your security’s OBV rises while its peers’ or index’s OBV is flat or falling, it could point to exceptional strength or weakness. Use a comparative table to track OBV differences:
| Security | OBV Trend | Market/Index OBV Trend | Implication |
|---|---|---|---|
| XYZ Corp | Rising | Flat | Stronger bullish signal for XYZ Corp |
| ABC Inc | Falling | Rising | Bearish divergence for ABC Inc |
Momentum Oscillators and OBV
OBV can be combined with momentum oscillators like RSI ( Relative Strength Index ) or MACD (Moving Average Convergence Divergence) to confirm trend strength or spot reversals. If your OBV is making higher highs in tandem with a momentum indicator, it reinforces the trend; however, if the OBV is flat while the momentum indicator surges, consider this a divergence that could signal a potential reversal.
Incorporate these advanced techniques in your OBV analysis to refine your understanding of market momentum and make well-informed trading decisions.
Indicators Related to OBV
When analyzing the On-Balance Volume (OBV) indicator, it’s important to understand how it interacts with other technical indicators. These relationships can enhance your market analysis by providing a more comprehensive view of market dynamics.
Relative Indicators
Your ability to interpret OBV can be strengthened by comparing it to other momentum indicators. These tools aim to predict future market movements by analyzing the velocity of price changes. A well-known momentum indicator is the Average Daily Trading Volume, which offers insights by averaging the volume over time. When used with OBV, you can gain a perspective on whether trading volume supports the current price trend.
OBV and MACD
The Moving Average Convergence Divergence (MACD) is a powerful technical indicator that assesses market momentum and potential price action through convergence and divergence with the asset’s price.
- Convergence happens when the MACD moves closer to the OBV, suggesting the current trend is strong.
- Divergence indicates the two measurements are moving apart. This could signal a weakening trend or a potential reversal.
You can use the OBV and MACD to confirm trend strength and look for trade signals based on convergence or divergence.
Volume-Price Trend (VPT) Indicator
The Volume-Price Trend (VPT) indicator multiplies the day’s volume by the percentage change in the closing price, cumulatively adding or subtracting this value. While OBV adds or subtracts the entire volume, VPT incorporates the size of the price movement. VPT can be considered a leading indicator, hinting at future price movements. It’s key to watch if the VPT moves in the same direction as the OBV; this may reinforce a trend suggested by price action. However, if VPT and OBV diverge, it could indicate a price volume discrepancy, warranting a cautious approach.
Limitations
The OBV assumes that volume precedes price, but this isn’t always true. It’s important to remember that OBV is a momentum indicator, which means it can sometimes misinterpret the market context. For example, bullish or bearish divergences can occur when price movement and OBV trend in opposite directions. A bullish divergence happens when the price is decreasing while OBV starts to increase, suggesting potential upward price pressure. Conversely, a bearish divergence is when the price increases and OBV is on the decline, indicating possible downward price pressure.
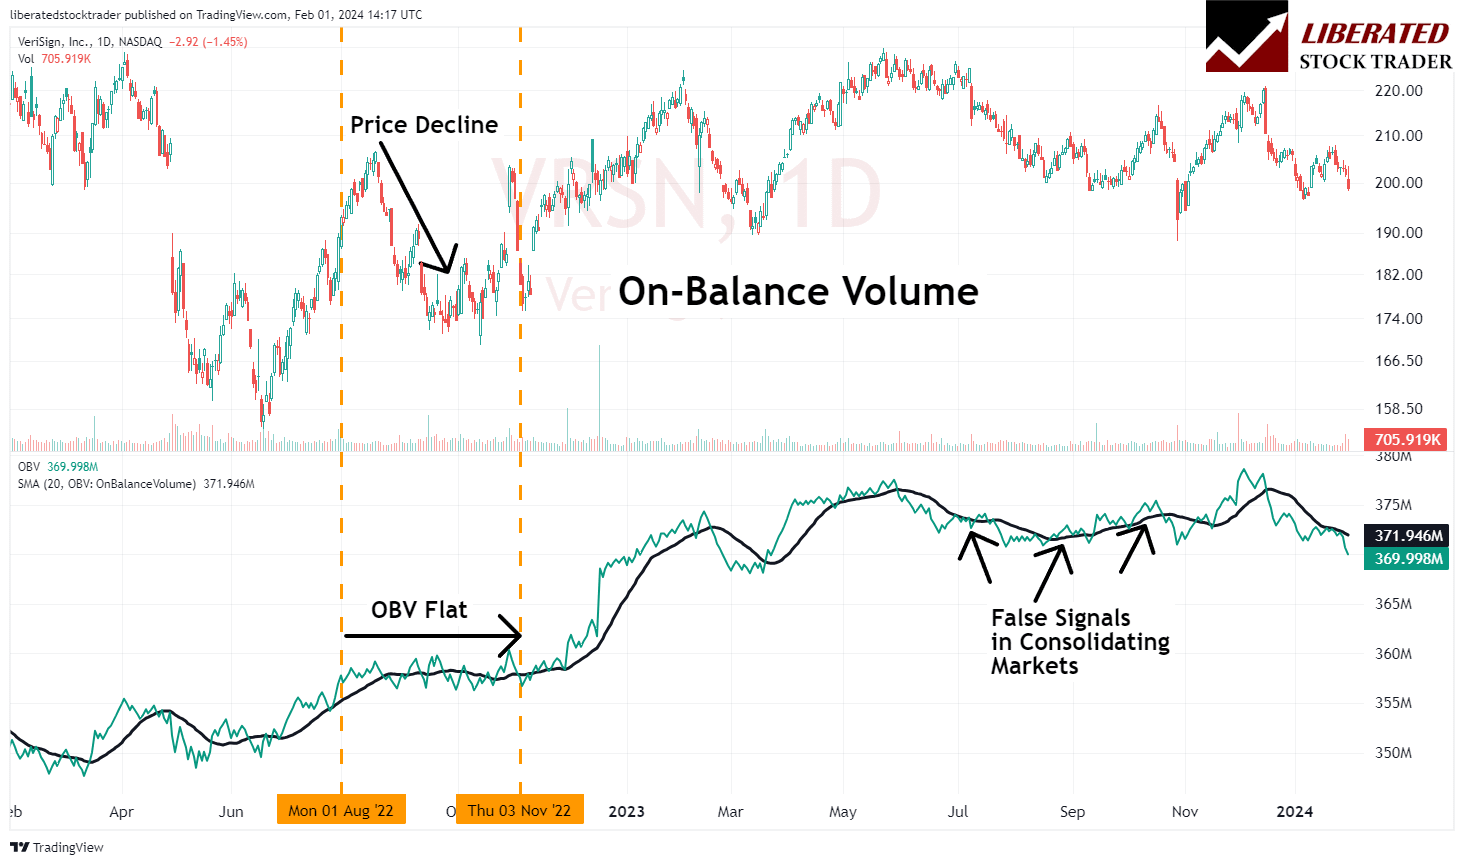
OBV False Signals
Like any technical indicator, OBV can generate false signals. During consolidation periods or when the market is making sharp, erratic movements, OBV might indicate a change in trend that’s not supported by the price action. This could lead you to buy or sell against incorrect prevailing trends, potentially resulting in losses.
Risk Management with OBV
To mitigate risk when using OBV, integrate it into a comprehensive trading plan that includes stop-loss orders and profit targets. Monitor for situations where the volume increase or decrease doesn’t align with the price trend, as this inconsistency could signal a potential reversal or continuation that OBV alone might not accurately capture. Always ensure you have confirmation from additional analysis or indicators beyond the OBV to make informed trading decisions. By recognizing these risks and limitations, your use of OBV can be refined to reflect the dynamics of the markets you’re navigating more accurately.
Advanced OBV
In this section, you’ll understand how volume can anticipate price movements and institutional investors’ significant role in shaping the On-Balance-Volume (OBV) indicator.
Volume Precedes Price
Volume precedes price, which is a key principle underlying the OBV. This concept posits that changes in volume often occur before corresponding price movements become evident. When you see a rising OBV, it suggests that the volume is increasing on days when the price finishes higher. Conversely, when OBV falls, volume is higher on days with lower closing prices.
- Increasing OBV = Higher volume on days the price moves up
- Decreasing OBV = Higher volume on days the price moves down
This can signal whether institutional or retail investors are actively trading securities since their activity often significantly impacts volume. For example:
| Price Trend | OBV Trend | Possible Interpretation |
|---|---|---|
| Upward | Increasing | Accumulation, bullish sentiment |
| Downward | Decreasing | Distribution, bearish sentiment |
| Upward | Decreasing | Weak trend, potential price drop |
| Downward | Increasing | Weak trend, potential price rise |
The Impact of Institutional Investors on OBV
Institutional investors, such as pension funds or quantitative value funds, can move markets due to the large volumes of assets they control. When these institutions buy or sell securities, their transactions can significantly influence the OBV. Due to their size, just a few institutional investors can create volume surges that propel the OBV—and thus anticipated price action—in a particular direction.
- Bullish Scenario: If pension funds are net buyers, a sustained increase in OBV might occur, hinting at potential price increases.
- Bearish Scenario: Conversely, if these funds are net sellers, a drop in OBV could precede a price decrease.
Recognizing how OBV trends can be shaped by these large players, rather than the more fragmented actions of retail investors, equips you with a strategic edge in anticipating market moves.
Case Studies
Your understanding of the OBV indicator can be further solidified by examining its application during notable historical market events. These case studies provide insight into how OBV can be a reliable tool to gauge market sentiment when you observe major moves, accumulation, and distribution patterns.
OBV in Major Market Moves
The OBV indicator can be particularly revealing in the context of major moves. Consider the analogy of a spring being wound tightly—this is how OBV behaves when an asset is about to make a significant move. If you had observed the OBV during the dot-com bubble, you might have noticed a robust accumulation phase where the green volume histograms outpaced the red ones. This signaled that despite the highs and lows, the overall volume increasingly supported higher prices.
| Period | OBV Trend | Market Outcome |
|---|---|---|
| Jan 1999 – Mar 2000 | Steadily Increasing | Dot-com Bubble Expansion |
| Apr 2000 – Oct 2002 | Declining | Dot-com Bubble Burst |
When analyzing any security, it’s crucial to remember that volume precedes price. An upward trend in OBV ahead of price changes indicates accumulation, while a downward trend may signal distribution. For instance, before the 2008 financial crisis, you might have noted declining OBV values despite the markets hitting new highs. This was a warning that a distribution phase was underway—predictive of the subsequent crash.
Granville’s Market Predictions
Joe Granville, the creator of the OBV indicator, made several successful market predictions based on the principles that volume precedes price and that volume trends confirm an asset’s price movement. One of his famous predictions was the 1981 market downturn. By monitoring the OBV, Granville identified a trend of declining volume as the markets were reaching highs, which he interpreted as a sell signal. His prediction came to pass when the market experienced a significant downturn shortly after.
- 1981 Prediction: OBV declined—Granville warned of a downturn.
- Market Response: A significant decline in stock prices followed.
By studying these historical performances, you gain a practical understanding of applying OBV analysis to anticipate potential market moves effectively. The green and red volume histograms are not merely colorful indicators on your chart; they are potent tools capable of signaling whether you’re in a phase of accumulation or distribution, which can guide your investment decisions.
FAQ
How do I interpret OBV divergence in trading?
OBV divergence occurs when the On-Balance Volume indicator and price action move in opposite directions. If the price rises while OBV falls, it suggests possible downward pressure on the price. Conversely, upward price movement may be forthcoming if the price is falling and OBV is rising.
Which volume indicators are considered better than OBV?
According to our research, the Price Rate of Change (ROC), and the Volume-Weighted Average Price (VWAP) can produce improved performance. Each of these has unique calculation methods and applications, and some traders may prefer them for their specific features or suitability to certain markets.
What does OBV tell us about market trends?
The OBV indicator is designed to show momentum by reflecting changes in volume. If OBV is on an uptrend, buying pressure increases, which can signify a bullish market trend. Similarly, a downtrend in OBV suggests growing selling pressure and a potential bearish market trend.
Can the On-Balance Volume (OBV) formula predict price movements accurately?
No indicator can predict market movements with 100% accuracy. However, the OBV is a powerful predictive tool in trending markets.
What is the most effective On-Balance Volume trading strategy?
One effective strategy is identifying OBV trend lines and watching for breakouts or breakdowns preceding price movements. This strategy relies on the idea that volume precedes price and aims to capitalize on early changes in buying or selling pressure indicated by the OBV.
Is there an optimal time frame for using the OBV indicator in market analysis?
The optimal time frame for the OBV indicator depends on your trading style. Short-term traders might prefer shorter time frames like minutes or hours, while long-term traders may find daily or weekly time frames more useful. Testing different time frames with backtesting can help identify what works best for your trading strategy.
What indicators can complement On-Balance Volume for more reliable signals?
To improve the reliability of On-Balance-Volume (OBV) signals, you can pair it with the Relative Strength Index (RSI), which measures price momentum, or the Moving Average Convergence Divergence (MACD), which helps to spot changes in the momentum, direction, and duration of a trend in a stock's price.
How is OBV divergence used to anticipate price movements?
OBV divergence happens when the price moves in one direction and the OBV moves in the opposite. A bullish divergence is when the price drops but OBV rises, suggesting that buying pressure is increasing, which could lead to an upward price movement. Conversely, a bearish divergence might indicate an upcoming downtrend.
What are the common settings for the OBV indicator to optimize its performance?
The standard setting for the On-Balance Volume (OBV) indicator does not involve different parameters as it is solely based on the cumulative volume with respect to the direction of the price. However, you can adjust the timeframe of your chart to identify trends over different periods more effectively.
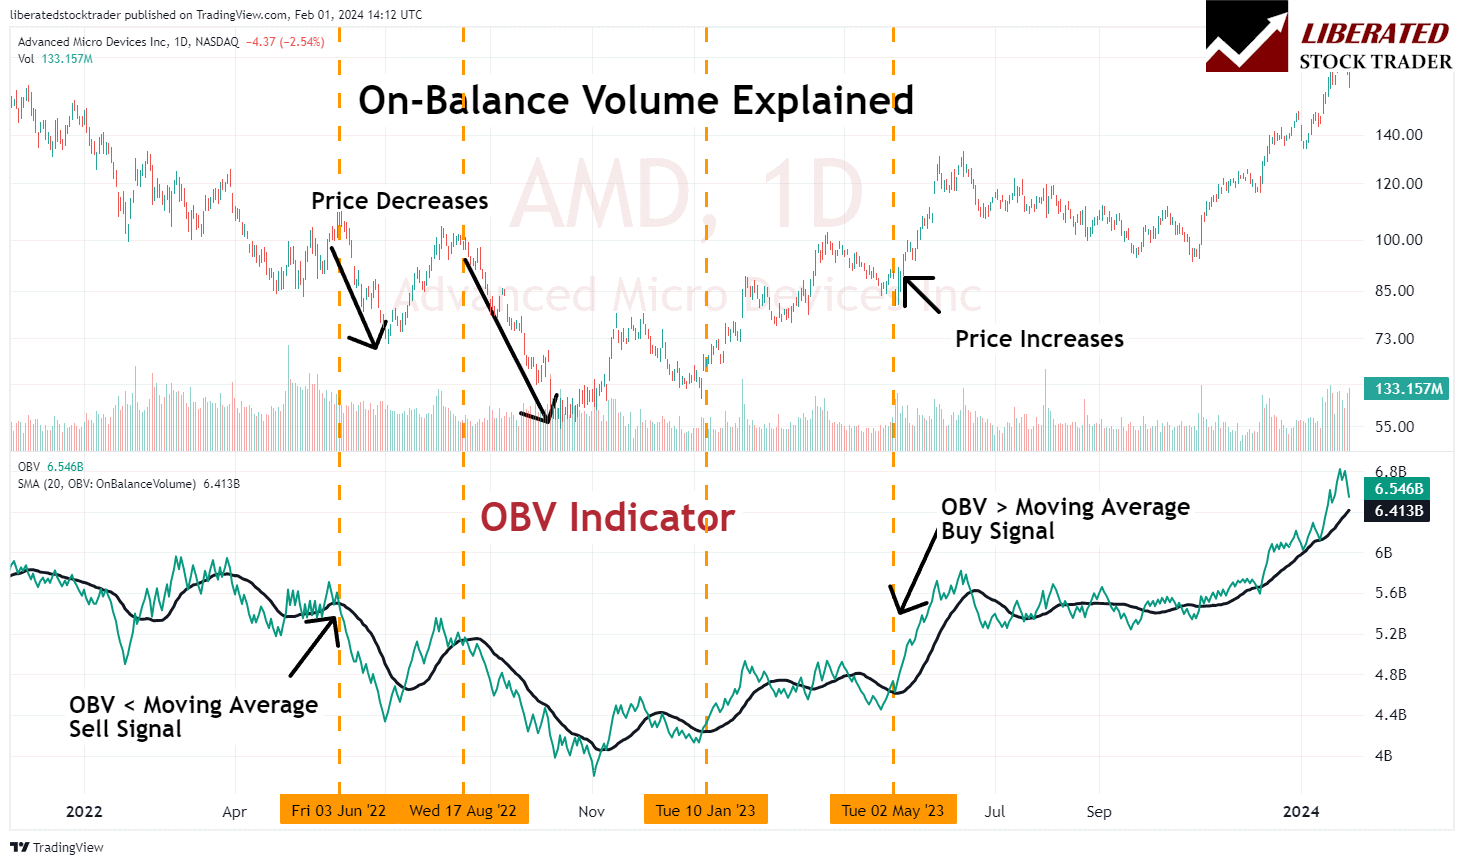
Can the OBV indicator be integrated with a moving average to enhance trading strategies?
You can integrate the OBV indicator with a moving average by plotting the moving average line directly on the OBV line. A crossover of OBV above its moving average may be considered a bullish signal, while an OBV falling below its moving average might be interpreted as bearish.
How can traders interpret a negative On-Balance Volume reading?
A negative On-Balance Volume reading indicates that overall volume is heavier when the asset's price falls. This often suggests higher selling pressure and might be seen as a bearish sign in the context of an asset's price trend.
What strategies involve the use of the On-Balance Volume indicator for successful trades?
Strategies involving the On-Balance Volume indicator often look for divergences or confirmations. For instance, if the price hits a new high but OBV doesn't, it could suggest that the uptrend is not backed by strong volume and could be reversing soon. Confirmatory strategies might use the OBV to confirm a trend alongside price action before making a trade.