
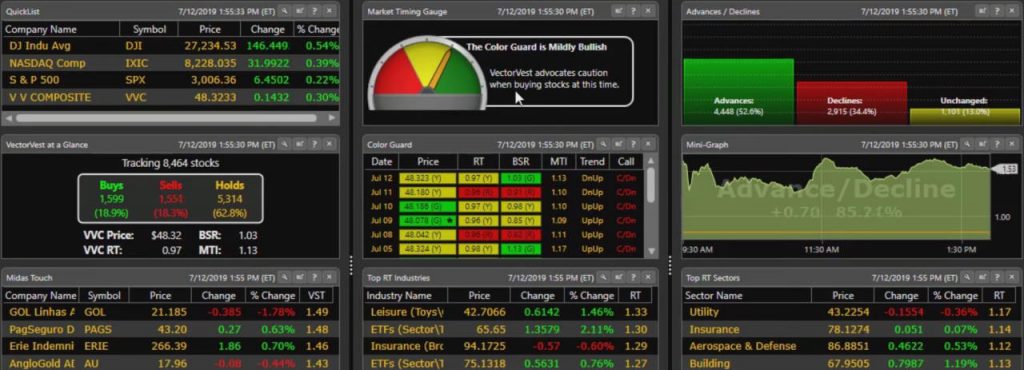
VectorVest is best understood as a guided stock-selection, portfolio-management, market-timing, and trading-plan platform, not as a deep technical charting workstation. In my lab testing, VectorVest scores 4.03, below the benchmark median of 4.21, but that headline score understates some of its specialist strengths. VectorVest’s strongest value is its proprietary stock rating system, buy/sell/hold recommendations, UniSearch stock discovery, Portfolio Manager, AutoTimer, QuickTest, alerts, and support infrastructure.
It remains weak for classic chart-pattern recognition, broker integration, real-time financial news, and advanced technical charting, but it is stronger than a simple stock screener. VectorVest says its system uses algorithms and market data to help investors make decisions, and its documentation confirms buy, sell, and hold recommendations on every stock based on its RV, RS, RT, and VST framework.
Lab Test Score Summary
VectorVest scores 4.03, which is below the benchmark median of 4.21, but the result is more nuanced than the headline score suggests. VectorVest is weak in pure technical-analysis depth, pattern recognition, and broker integration, but it performs much better as a guided investment-decision platform. Its leading scores include 3 Click Rule Ease 5.00, Concurrent Alerts 5.00, Alert Speed 5.00, Multi-Stock Basket Backtesting 5.00, and Support 4.50.
| Test | Tier | Score | Average |
|---|---|---|---|
| Composite Lab Performance Score (CLPS) | A | 4.03 | 4.21 |
| Pricing Index | A | $4.90/day | $2.74/day |
| Value Score (VP) | C | 2.99 | 2.82 |
| Speed & Ease of Use | AA | 4.33 | 4.50 |
| Chart Analysis Depth Index | C | 1.25 | 3.17 |
| Chart Pattern Depth & Accuracy | C | 0.23 | 2.73 |
| Scanning Performance | C | 2.75 | 3.38 |
| Backtesting Performance | B | 3.60 | 3.38 |
| Trading Bot & Auto-Trading Reliability | B | 3.00 | 2.50 |
| AI & Algo Index | C | 2.25 | 2.00 |
| Alert Speed | AA | 4.33 | 3.67 |
| Trade Signal Quality | C | 2.50 | 0.00 |
| Broker Connectivity & Ecosystem Depth | C | 1.55 | 2.00 |
| Portfolio Tool Performance | A | 4.00 | 2.80 |
| Financial News Speed & Depth | C | 2.00 | 2.80 |
| Community Utility Index (CUI) | B | 3.00 | 3.25 |
| Support Infrastructure & SLA Audit | AA | 4.50 | 3.75 |
Composite Lab Performance Score (CLPS)
| Metric | Calculation | VectorVest | High | Median | Low |
|---|---|---|---|---|---|
| Composite Lab Performance Score (CLPS) | Average for all ratings + 5X Superpower Boost for Top 5 killer features | 4.03 | 4.75 | 4.21 | 2.93 |
The CLPS confirms VectorVest’s real identity: it is a structured stock-selection and portfolio-management system, not a general-purpose trading terminal. It emphasizes stock analysis, portfolio management, alerts, automated backtesting, and trading-plan support. That explains the lab outcome. VectorVest is strongest for users who want simplified stock ratings, market timing, portfolio guidance, and buy/sell discipline. It is weaker for traders who want deep indicators, custom charting, broker-neutral execution, or automated chart-pattern detection.
Verdict
VectorVest is a good platform for investors who want a structured stock-selection, market-timing, portfolio-management, and alert-driven decision system. In my lab testing, it scores 4.03, below the median but still credible because its strengths are concentrated in support, alerts, portfolio tools, trade guidance, and ease of use. I would not choose VectorVest for advanced charting, automated pattern recognition, broker integration, or deep technical scanning. But for users who want a guided investing methodology with strong support and actionable portfolio discipline, VectorVest remains a useful specialist platform.
Reasons to Consider
- Strong guided investing workflow: VectorVest combines stock ratings, buy/sell/hold recommendations, market timing, portfolio management, stop guidance, alerts, and education into one structured system.
- Better portfolio and backtesting functionality than first credited: After re-audit, Portfolio Tools rise to 4.00, Backtesting to 3.60, and Trading Bot Reliability to 3.00.
- Excellent alerts and support: Alert Speed scores 4.33, and Support Infrastructure scores 4.50, both clearly above the benchmark median.
Reasons to Avoid
- Weak technical charting: Chart Analysis Depth scores only 1.25, far below the median 3.17.
- Very weak classic pattern recognition: Chart Pattern Depth & Accuracy scores 0.23, making VectorVest unsuitable as a serious automated chart-pattern platform.
- Poor broker integration: Broker Connectivity scores 1.55, with Broker Integration only 0.10, so most users should expect to analyze in VectorVest and execute elsewhere.
Pricing Index
| Metric | Calculation | VectorVest | High | Median | Low |
|---|---|---|---|---|---|
| Cost-per-day | $/day on an annual plan. Minimum viable plan with real-time exchange data | $4.90 | $9.99 | $2.74 | $0.74 |
VectorVest costs $4.90/day in the lab dataset, which is above the benchmark median of $2.74/day. That makes it more expensive than many charting and screening platforms, especially when compared with tools such as TradingView, StockCharts, or lower-cost broker-distributed platforms. The pricing score should be interpreted in context: VectorVest is not just selling charts. It is selling a guided investment-decision framework, stock ratings, portfolio management tools, alerts, and trading-plan support.
The price is easier to justify if users rely on its proprietary ratings, portfolio guidance, alerts, and market-timing tools, but harder to justify if they only want charting.
Value Score (VP)
| Metric | Calculation | VectorVest | High | Median | Low |
|---|---|---|---|---|---|
| Value Score | Sum of Feature Quality, Feature Depth, and Device Support Depth | 2.99 | 4.37 | 2.82 | 1.70 |
VectorVest scores 2.99 for Value, slightly above the median benchmark of 2.82. This is a respectable result because VectorVest has high feature depth at 4.30, even though some technical-analysis categories are weak. The score says VectorVest is not a broad all-rounder, but it does deliver meaningful value for investors who use its proprietary decision tools. Its above-median value score comes from guided stock ratings, portfolio tools, alerts, and strategy support.
VectorVest’s value depends heavily on whether the user wants its specific investment process. The platform uses algorithms and market data to help investors make informed decisions, and it also promotes one-to-one coaching as part of the user experience. That matters because VectorVest is not just a data terminal. It is a system with training, ratings, portfolio management, and buy/sell guidance. For self-directed technical analysts, the value is weaker; for guided investors, it is stronger.
Speed & Ease of Use
| Metric | Calculation | VectorVest | High | Median | Low |
|---|---|---|---|---|---|
| Speed & Use Index Rating | Average of Time to Chart Performance, Multimonitor Chart Speed, and 3 Click Rule Ease of Use | 4.33 | 5.00 | 4.50 | 3.30 |
VectorVest scores 4.33 for Speed & Ease of Use, just below the benchmark median of 4.50. The strongest usability score is 3 Click Rule Ease of Use 5.00, supported by Time to Chart Performance 4.50. Multimonitor Chart Speed is lower at 3.50, which prevents VectorVest from ranking with the fastest chart-native platforms. Overall, VectorVest is easy to navigate for its intended purpose.
The interface is built around simplifying decisions rather than exposing every charting variable. VectorVest offers useful charting features accessible from different parts of the program and emphasizes automated processes and ease of use. That helps explain the lab score: VectorVest works well when users follow its built-in workflow, ratings, portfolios, alerts, and timing tools. It is less suited to users who want a deeply customizable, multi-monitor trading cockpit.
Chart Analysis Depth Index
| Metric | Calculation | VectorVest | High | Median | Low |
|---|---|---|---|---|---|
| Chart Analysis Depth Index | Average of Chart Depth, Indicator Depth, and Custom Coding Scores | 1.25 | 5.00 | 3.17 | 0.50 |
Chart Analysis Depth is one of VectorVest’s weakest categories, scoring only 1.25 versus the benchmark median of 3.17. The weakness comes from limited indicator depth, which scores 1.30, and lower technical charting flexibility compared with dedicated platforms such as TradingView, MetaStock, or TC2000. VectorVest is not designed for traders who want hundreds of indicators, custom chart types, public script libraries, or deep technical-analysis experimentation.
Feature-wise, VectorVest does provide charts, but those charts are part of a broader decision system rather than the platform’s central edge. VectorVest can support visual stock review, but technical analysts who rely on indicator stacking, custom studies, and advanced chart layouts need a stronger charting platform alongside it.
Chart Pattern Depth & Accuracy
| Metric | Calculation | VectorVest | High | Median | Low |
|---|---|---|---|---|---|
| Pattern Recognition Efficacy & Accuracy | Average of Pattern Recognition Depth and Accuracy Scores | 0.23 | 4.88 | 2.73 | 0.00 |
VectorVest scores 0.23 for Chart Pattern Depth & Accuracy, far below the median 2.73. Pattern Recognition Depth is one of its weakest scores at 0.50. This means VectorVest should not be judged as an automated chart-pattern platform. It does not compete with TrendSpider, TradingView, Trade Ideas, or MetaStock for systematic candlestick or chart-pattern detection. This is a clear mismatch for pure technical pattern traders.
The feature set explains why. VectorVest focuses on stock ratings, market timing, portfolio guidance, alerts, and strategy discipline rather than automated pattern libraries. It emphasizes algorithms, market data, alerts, backtesting, and portfolio management, not pattern-recognition depth. Traders who rely on head-and-shoulders patterns, wedges, triangles, candlestick clusters, or automated multi-timeframe pattern scans should use another tool. VectorVest users are better served by its proprietary ratings and portfolio discipline than by technical pattern workflows.
Scanning Performance
| Metric | Calculation | VectorVest | High | Median | Low |
|---|---|---|---|---|---|
| Market Scanning Latency & Depth | Average of Scanning Speed, Criteria Depth, and Custom Code Scores | 2.75 | 5.00 | 3.38 | 0.80 |
VectorVest scores 2.75 for Scanning Performance, well below the benchmark median of 3.38. The score is held back by Scanning Criteria & Depth 1.90, though Scanning Speed Points are better at 3.00. This tells us VectorVest is not a deep custom scanner in the same way as TradingView, TrendSpider, Trade Ideas, Stock Rover, or Portfolio123. It is more guided and system-driven.
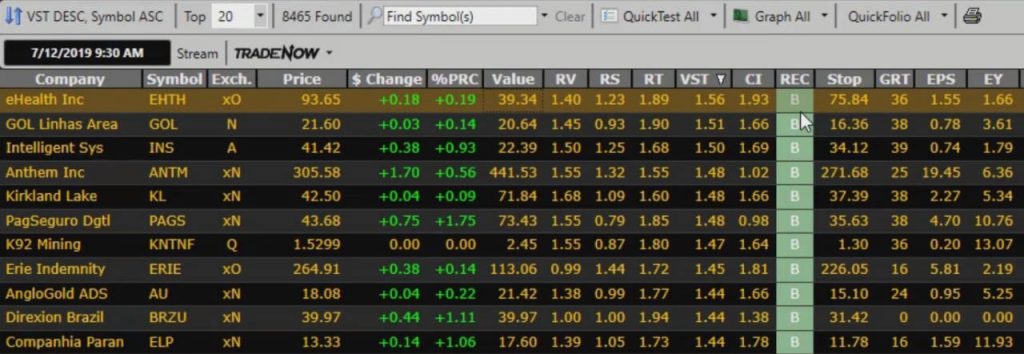
VectorVest scanning is proprietary and guided, not fully open-ended technical/code scanning. Its strength is finding stocks using VectorVest’s own indicators, rankings, searches, strategies, and market-timing logic. Its weakness is lower flexibility for traders who want hundreds of raw technical/fundamental criteria, custom formulas, open scripting, or deep intraday event scans.
That can be useful for users who want a simplified ranking system. But advanced traders who need hundreds of scan conditions, custom formulas, technical event scans, or code-level scanning will find VectorVest restrictive.
Backtesting Performance
| Metric | Calculation | VectorVest | High | Median | Low |
|---|---|---|---|---|---|
| Quantitative Backtesting Fidelity | Average of Backtesting Speed, No Coding Required, Flexible Coding, Report Quality, and Multi-Stock Backtesting Scores | 3.60 | 4.90 | 3.38 | 0.00 |
VectorVest scores 3.60 for Backtesting Performance, below the median 3.38, but still useful. Its strongest sub-score is Multi-Stock Basket Backtesting 5.00, which is important because VectorVest is more portfolio-oriented than single-chart oriented. Backtesting Speed also scores 4.00, and Backtesting Report Quality is reasonable at 3.30. The weakness is that it is less flexible for advanced custom strategy research.
VectorVest’s QuickTest feature is available in RealTime and End-of-Day modes, while AutoTimer is promoted as a way to test strategies before risking capital and to automate market timing inside the Backtester and portfolios. VectorVest describes AutoTimer and Portfolio Genius as tools for creating, testing, and refining automated trading systems involving market timing, stock selection, stops, and portfolio management.
VectorVest is not an open quant research environment. Its backtesting is strongest for VectorVest-style portfolio strategies, not fully custom-coded systematic research. It appears especially strong for basket-style strategy testing, portfolio-level timing, and guided trading plans
The backtesting capability fits VectorVest’s guided investing model. AutoTimer allows users to test strategies before risking capital, then receive alerts when the trading plan calls for action. That is exactly the kind of backtesting where VectorVest makes sense: validating predefined or guided investing strategies across multiple stocks. It is less suited to coders who want to build highly customized systems from scratch.
Trading Bot & Auto-Trading Reliability
| Metric | Calculation | VectorVest | High | Median | Low |
|---|---|---|---|---|---|
| Automated Execution & Bot Reliability | Sum of Automation Path, Strategy/Bot Sophistication, and Operational Assurance Points | 3.00 | 4.50 | 2.50 | 1.50 |
VectorVest scores 3.00 for Trading Bot & Auto-Trading Reliability, exactly matching the median benchmark. This means it has meaningful automation support but should not be viewed as a full hands-off trading-bot platform. VectorVest can help automate trading plans, alerts, and portfolio rules, but broker integration is weak at 0.10, so automated execution is not its primary strength. Its automation is decision-support oriented.
VectorVest’s AutoTimer language supports this interpretation. AutoTimer is a trading-plan automation that alerts users when they need to make a trade. That is useful because it automates discipline and timing prompts, not necessarily live order execution. Investors who want rule-based portfolio management and action alerts may like this. Traders who want direct broker execution automation should look elsewhere.
AI & Algo Index
| Metric | Calculation | VectorVest | High | Median | Low |
|---|---|---|---|---|---|
| Algorithmic Intelligence & AI Tier Index | Sum of Algo Depth, AI Layer, and Transparency Points | 2.00 | 5.00 | 2.00 | 1.00 |
VectorVest scores 2.00 for AI & Algo, exactly matching the benchmark median. It is algorithmic in the sense that it uses proprietary scoring, stock ratings, market data, rankings, alerts, and trading-plan logic. But it is not an AI-native platform in the modern sense of machine-learning signal generation, explainable AI trade recommendations, or user-built quantitative models. The score says VectorVest is systematic, but not a cutting-edge AI platform.
VectorVest uses advanced algorithms and market data to help investors make informed decisions. That aligns with the lab score. VectorVest has a rules-and-ratings engine, but the user does not get the same transparent coding environment offered by Pine Script, thinkScript, EasyLanguage, or Portfolio123 formulas. It is better described as a proprietary algorithmic investing framework than an open algo-development platform.
Alert Speed
| Metric | Calculation | VectorVest | High | Median | Low |
|---|---|---|---|---|---|
| Alert Trigger Latency & Delivery Speed | Average of Concurrent Alerts, Alert Streams Richness, and Alert Speed Rating Scores | 4.33 | 4.67 | 3.67 | 2.33 |
Alert Speed is one of VectorVest’s strongest categories, scoring 4.33 versus the median 3.67. The leading sub-scores are Concurrent Alerts 5.00 and Alert Speed Rating 5.00. This is important because VectorVest’s value depends on delivering timely action prompts: what to buy, what to sell, when to manage stops, and when to follow a trading plan. The alert system is central to the platform’s utility.
VectorVest alerts are designed to keep users ahead of the curve, and customized alerts and automatic stop-loss signals display inside the portfolio tools. This is where VectorVest is stronger than its charting scores suggest. It may not be a deep pattern platform, but it is good at turning its proprietary rules into actionable alerts.
Trade Signal Quality
| Metric | Calculation | VectorVest | High | Median | Low |
|---|---|---|---|---|---|
| Signal Alpha & Predictive Efficacy | 5 = audited specific trade signals; 2.5 = buy/sell gauges or systemic signals | 2.50 | 5.00 | 0.00 | 0.00 |
VectorVest scores 2.50 for Trade Signal Quality, above the benchmark median of 0.00. This is a meaningful advantage. Under the lab rubric, 2.50 indicates buy/sell gauges or systemic signals rather than fully audited specific trade-signal performance. VectorVest’s proprietary ratings and timing tools are therefore useful for structured decision support, but they should not be treated as independently audited alpha signals.

This score fits the product. VectorVest focuses on helping investors know what to buy, when to buy, and when to sell. That is stronger than a passive screener, because the system provides action-oriented guidance. However, readers should still apply risk controls and not confuse platform-generated buy/sell logic with guaranteed predictive performance.
Broker Connectivity & Ecosystem Depth
| Metric | Calculation | VectorVest | High | Median | Low |
|---|---|---|---|---|---|
| Asset & Data Coverage Index | Average of Live Trading, Broker Integration, and Asset/Data Coverage Scores | 1.55 | 5.00 | 2.00 | 0.67 |
VectorVest scores 1.55 for Broker Connectivity & Ecosystem Depth, below the median 2.00. The reason is clear: Broker Integration 0.10 is one of its weakest scores. Asset & Data Coverage is better at 3.00, but the platform is not a broker-neutral trading hub. This makes VectorVest much more suitable for analysis and portfolio guidance than for execution.
VectorVest does have some brokerage-account linking context through Yodlee for holdings and analysis workflows, but that is not the same as broad broker execution integration. Investors can use VectorVest to analyze stocks, manage portfolios, receive alerts, and guide decisions, then execute trades elsewhere. Traders who want direct multi-broker order routing should use a different platform.
Portfolio Tool Performance
| Metric | Calculation | VectorVest | High | Median | Low |
|---|---|---|---|---|---|
| Portfolio Health & Risk Analytics | Portfolio health, reporting, and risk analytics coverage | 4.00 | 4.80 | 2.80 | 2.00 |
Portfolio Tool Performance is a VectorVest strength, scoring 4.00 versus the median 2.80. This is one of the main reasons the platform scores better overall than its charting and scanning numbers would suggest. VectorVest is built around stock ratings, portfolio management, stop guidance, timing, and strategy discipline. Its portfolio score indicates that it has more useful portfolio-level functionality than many trading-only tools.
VectorVest’s Portfolio Manager is for analyzing and managing portfolio performance, including settings for automating buy/sell instructions, customized alerts, and automatic stop-loss signal displays. VectorVest is more useful for managing a basket of holdings than for drawing trendlines or coding indicators. Investors who want rules-based portfolio oversight will see more value than short-term chart traders.
Financial News Speed & Depth
| Metric | Calculation | VectorVest | High | Median | Low |
|---|---|---|---|---|---|
| Financial News Speed & Quality Rating | Weighted rubric covering news scanning, plots, watchlists, filtering, providers, alerts, and real-time delivery | 2.00 | 5.00 | 2.80 | 0.00 |
VectorVest scores 2.00 for Financial News Speed & Depth, below the median 2.80. This means it should not be used as a real-time news platform. It may provide market context and decision support, but it does not compete with Benzinga Pro, Scanz, Bloomberg, eSignal, or other news-first platforms for breaking headlines, analyst actions, earnings catalysts, or fast market-moving news.
The feature set supports that conclusion. VectorVest emphasizes stock analysis, portfolio management, alerts, backtesting, and trading-plan automation rather than fast financial news feeds. That is not necessarily a flaw; it simply defines the use case. VectorVest is best for systematic portfolio and stock-selection decisions, while traders relying on catalysts should pair it with a dedicated real-time news service.
Community Utility Index (CUI)
| Metric | Calculation | VectorVest | High | Median | Low |
|---|---|---|---|---|---|
| Community Utility Index | Average of Active Community Size and Quality of Community Contribution Scores | 3.00 | 5.00 | 3.25 | 1.75 |
VectorVest scores 3.00 for Community Utility, slightly below the median 3.25. That suggests the platform has a useful but not market-leading community. It does not have the social scale of TradingView, nor the open-code ecosystem of platforms with public scripts and developer communities. The user community is more educational and system-oriented than social.
VectorVest does support users through training, coaching, education, and product support. Its FAQ mentions a free one-to-one coaching session, and the ecommerce plan page references free education courses and a successful investing coaching group. This explains the score: VectorVest community utility comes more from structured education and coaching than from user-generated indicators, public strategies, or large social chart-sharing networks.
Support Infrastructure & SLA Audit
| Metric | Calculation | VectorVest | High | Median | Low |
|---|---|---|---|---|---|
| Support SLA Audit: Time-to-Human Benchmarks | Average of Support Communication Channels and Support Response Time Scores | 4.50 | 5.00 | 3.75 | 1.00 |
Support is VectorVest’s strongest category, scoring 4.50 versus the median 3.75. Both Support Communication Channels and Support Response Times score 4.50. This is important because VectorVest is a methodology-driven platform. Users are not only learning software; they are learning the VectorVest rating system, portfolio tools, timing model, alerts, and strategy process. Strong support reduces the risk of paying for a system and not using it properly.
VectorVest lists phone support, website chat, email support, and international phone number access for users outside the U.S. and Canada. That is better than many software-only trading platforms. VectorVest also emphasizes education and coaching, which strengthens its practical support ecosystem. This category is a major reason to consider the platform, especially for investors who want guided onboarding.
