Point and Figure (P&F) charts are a unique form of technical analysis that focuses solely on price action, disregarding time and volume. They utilize ‘Xs and ‘Os to depict price movements, with ‘X’ representing an increase and ‘O’ a decrease.
Unlike regular candlestick or bar charts, Point and Figure charts only focus on price action and ignore time completely. This makes them perfect for swing traders looking to take advantage of short-term moves in the stock market.
What are Point and Figure Charts?
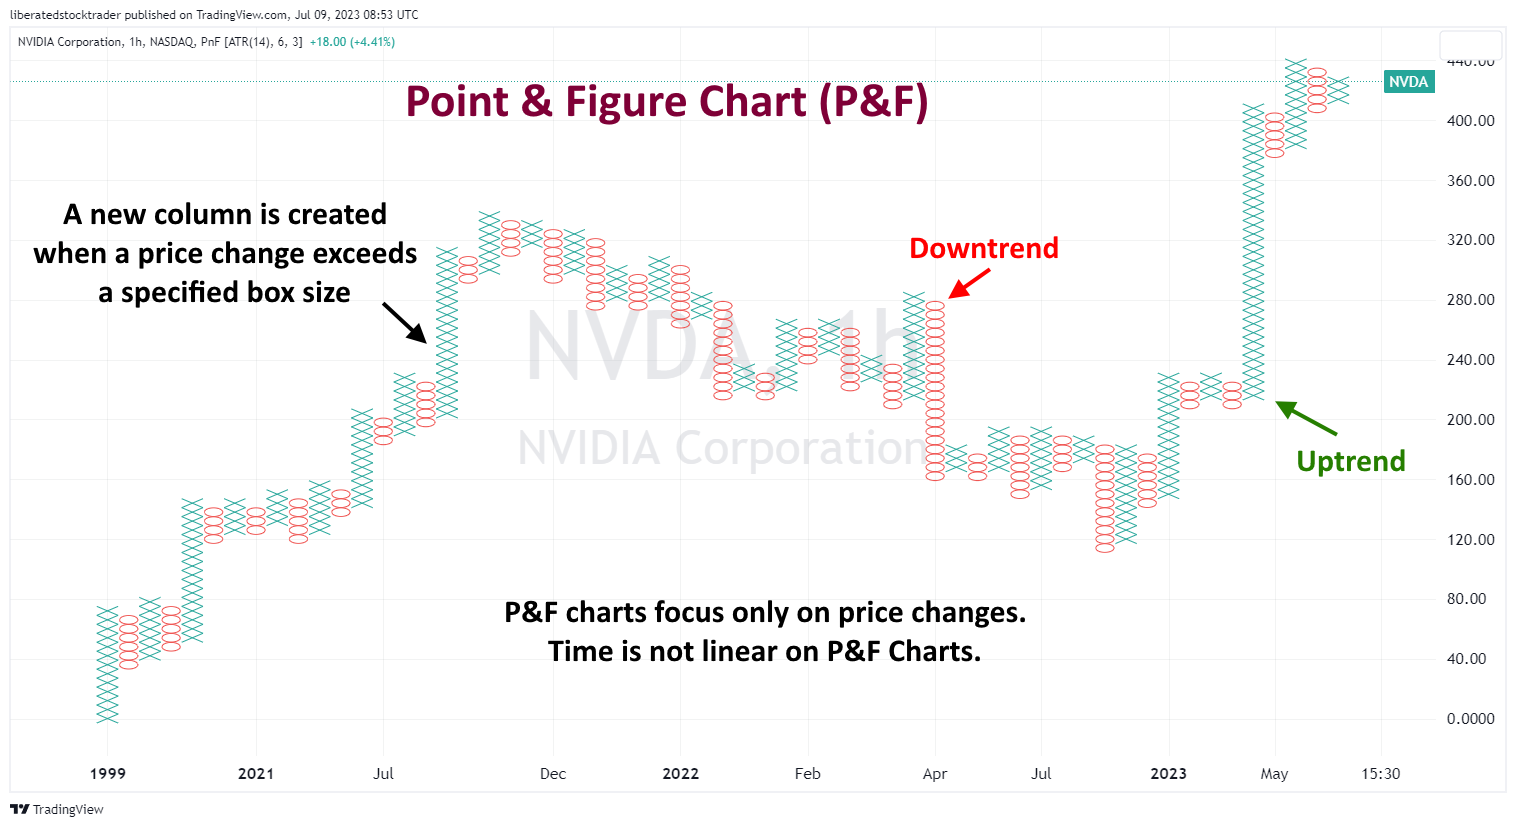
Point and figure charts (P&F) are unusual as they feature no timeline along the bottom horizontal chart axis. The P&F chart is made up only of price swings. The vertical price bar is arithmetic and shows only units of the price. An “O” is plotted if the price moves down a whole price unit, for example, 50 cents.
Then, when the price changes direction and moves upwards, an “X” is marked in each box. This filters out smaller price moves and lets us focus on trend quality. Trendlines are always plotted either horizontally or at 45-degree angles.
Free Point & Figure Charts
TradingView uniquely offers free real-time point and figure charts for stocks, currencies, and ETFs. It also boasts a vibrant global user community, making it the preferred choice for traders worldwide.
Get Free Point & Figure Charts on TradingView
While there are limited options for free point and figure charts, TradingView offers highly configurable free P&F charts. Personally, I rely on TradingView daily. You can find me there by following my profile.
Chart, Scan, Trade & Join Me On TradingView for Free
Join me and 20 million traders on TradingView for free. TradingView is a great place to meet other investors, share ideas, chart, screen, and chat.
Understanding Point & Figure Charts
Point and figure charts (P&F) are composed of ‘Xs and ‘Os, representing price movements. When the prices increase, an ‘X’ is plotted on the chart, and an ‘O’ is plotted when they move down. These charts help traders identify support and resistance levels by plotting points that signify a reversal in the trend. P&F charts ignore time and volume, making them ideal for identifying long-term trends.
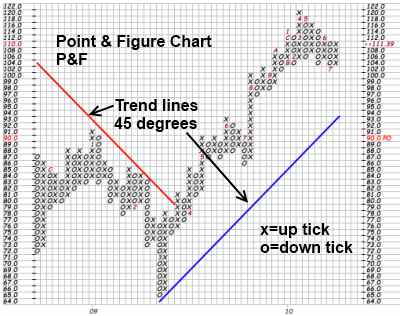
Each point on a P&F chart represents a set price movement (the box size). This eliminates noise and helps traders identify similar trends. For example, a box size of $5 would mean that each ‘X’ or ‘O’ represents the stock moving up or down by at least $5.
How to Trade P&F Charts
By studying point and figure charts, traders can identify resistance and support levels by looking for patterns of ‘Xs and ‘Os that indicate a potential reversal in price movement. They can also look for breakouts when prices move out of the pattern and continue in the opposite direction. This is often seen as an indication that the trend is changing and may be used as a signal for entering or exiting a position.
Point and figure charts can also help identify consolidation areas when prices move within a range without making significant progress, either up or down. This type of charting allows traders to identify potential opportunities to enter or exit positions based on their analysis.
Old School and still cool, Point and Figure charts are used by market makers to plan trades and targets.
Point & Figure Chart Pros
Point and Figure charts highlight potential support and resistance levels more clearly than other charting techniques. Plotting out price action in columns makes it easier to spot where there may be a trend reversal or consolidation. Similarly, it is easy to identify potential breakouts when the stock price moves outside the support and resistance boundaries.
Point & Figure Chart Cons
The biggest disadvantage of using Point and Figure charts is that the charting technique does not track time. Since it only tracks prices, traders may miss out on potential trading opportunities if they wait for a technical pattern to form. Additionally, the X’s and O’s can be difficult to interpret without understanding the rules and conventions associated with the charting technique.
Finally, Point and Figure charts only provide limited information, making it difficult to determine the strength or momentum behind a trend. While bigger boxes can indicate stronger trends, there is no way to measure the overall magnitude of the trend. Understanding volume and other technical indicators in conjunction with point and figure charting is important for generating successful trading strategies.
Summary
Point and Figure (P&F) charts are a distinctive type of technical analysis that concentrates solely on price action, disregarding time and volume. They employ ‘Xs and ‘Os to illustrate price movements, with ‘X’ denoting an ascent and ‘O’ a descent.
P&F charts are particularly useful in identifying support and resistance levels, trend reversals, and potential breakouts, offering an advantage to traders in their decision-making process. However, they have shortcomings, including a lack of time tracking and limitations in the information provided, making it difficult to gauge the strength or momentum of a trend.
Despite these drawbacks, when combined with other technical analysis tools, P&F charts can provide valuable insights. Even with their old-school approach, they remain a relevant tool for market analysis, beneficial for swing traders and long-term investors.

