Charles Dow was the founding father of the technical analysis of stocks and markets.
Dow theory’s six principles underpin technical analysis: The market discounts everything; it has three trends and phases; the averages must confirm each other; volume confirms the trend and a trend continues until it reverses.
These principles form the backbone of modern Technical Analysis of stocks.
Video From The Liberated Stock Trader Pro Masterclass Course
What is Dow Theory?
In 1882, Charles Dow and Edward Jones formed Dow Jones & Company. Out of this company came the theories that form most of the basis of technical analysis today. In 1884, Charles Dow published the first-ever stock index, the Industrial Average, consisting of 11 companies. In 1897, Charles Dow created the Rail Index, also known as the Transport Index. In 1928, the Industrial Average grew to 30 stocks, the famous DJ-30.
I learned Dow Theory later in my career and wished I had learned it earlier. It is so powerful and puts market analysis into perspective; he was a gifted thinker.
Dow’s theories boil down to six tenets or principles. The descriptions below are simplified for readability. To read Charles Dow’s actual texts, you will need to get copies of the articles he wrote for the New York Times, as he never wrote a book.
Using a mix of Dow Theory and the right indicators, it is possible to understand the current character of the market. Stock market pundits and supposed “gurus” always look to give their opinions on TV and in newspapers. But who should you believe? I think you should form your own opinion.
This article will show you one way to form a hypothesis about the market based on solid Technical Analysis.
The 6 Principles Dow Theory.
1. The Market Discounts Everything.
As soon as news is made available to the market, prices should be discounted (or appreciated) accordingly. The market participants discount everything, including past, present, and future expectations. Also built in are emotions, fads, and trends.
2. The Market has 3 Trends
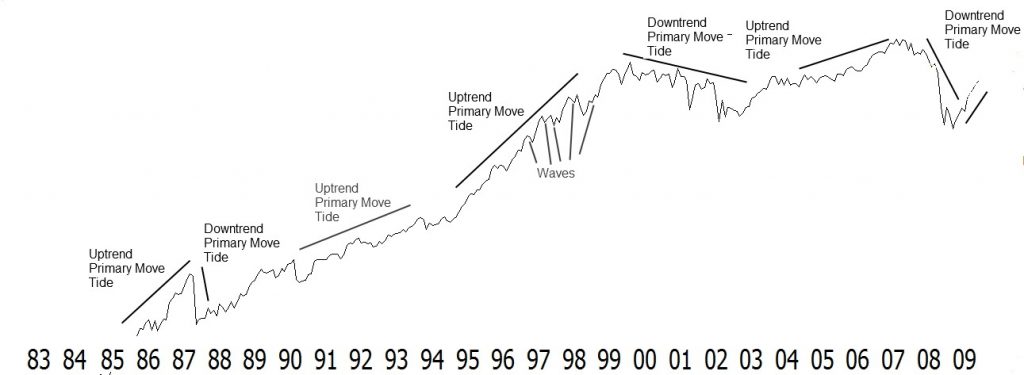
- Primary Move: The major directional move of Dow compared to the tide of the sea. This trend lasts from months to years.
- Secondary Move: He likened it to the waves of the sea, which lasted from weeks to months.
- Minor Move: He compared the ripples on the waves, which lasted from days to weeks. Charles Dow believed that minor trends could be random, but the other two trends are parts of a cyclical trend.
This is a fascinating analogy because it has a huge meaning in understanding the market. The tide is fairly predictable; we know the times of the tide and the distance the tide moves in any direction. The waves can vary in size, but they depend on the movement of the tide for direction. The ripples are essentially chaotic, unpredictable movements that do not affect the overall movement of the ocean.
3. The Primary Trend Has 3 Phases
- Phase 1 – Accumulation. The far-sighted investors who have seen a potential recovery
- Phase 2 – Public Participation. Company earnings are proving good, and the general public has started participating.
- Phase 3 – Distribution. Far-sighted investors start to sell as they see Stock Price growth is unsustainable compared to company earnings or economic climate.
The “Accumulation phase” is when the informed buyer or far-sighted investor sees that the opportunity ahead is positive, the business climate is changing, and there is strong value in the market, so they begin to invest. “Public participation” is when the general public sees that the market is going up and looks positive, and the public starts investing. The “Distribution phase” begins while the market is going up. The far-sighted investors begin to see the economic climate worsening, and company fundamentals are weakening, and they sell into the rally.
My thorough testing awarded TradingView a stellar 4.8 stars!
With powerful stock chart analysis, pattern recognition, screening, backtesting, and a 20+ million user community, it’s a game-changer for traders.

Whether you're trading in the US or internationally, TradingView is my top pick for its unmatched features and ease of use.
Explore TradingView – Your Gateway to Smarter Trading!
4. The Averages Must Confirm Each Other
Dow indicated that we can see when a new bull market is in place when both the DJ-30 and the DJ-20 prices have risen past a previous secondary peak. This is extremely powerful because he suggests that the comparison of the direction of the industrial companies and the transport companies, which essentially provide the logistics for the large industrial companies, should be moving in the same direction. When one fails to confirm the direction of the other, the economy or the business climate may not be healthy.
The next chart will show you this exact comparison. Over the long term, the averages move roughly in a synchronized manner; however, when one fails to confirm the other, you can see the consequences. I have marked on the chart below where I believe Dow’s theory would have flagged Bull and Bear markets.
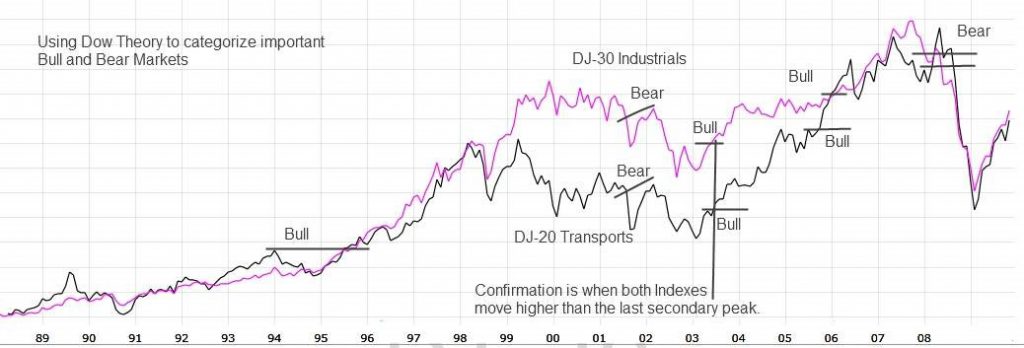
This theory still works on many levels, and we can compare different markets.
Both must be in sync using the Dow Jones Industrial Average and the Dow Jones Transports to have a definite trend. When both indices move down, this is the start of a bear market, for example.
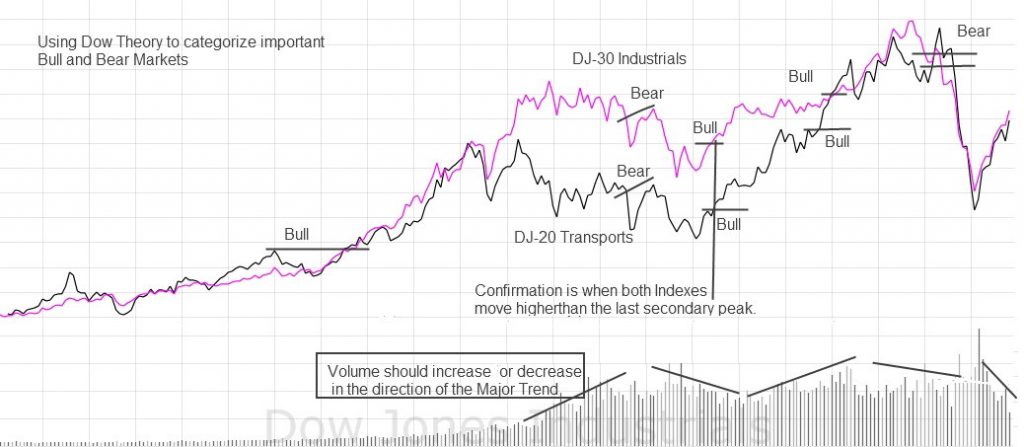
5. Market Action: Volume Must Confirm the Trend
Dow states that volume should follow the trend, and most technical analysts still believe this. Markets rise on increasing volume and fall on decreasing volume. Any significant drops in volume during a rising market mean that the demand for stocks at the current prices is dropping, and lower demand means prices may decrease to encourage more buyers into the marketplace.
Of course, Dow suggested that this rule is not as important as the previously stated tenets; however, a whole area of volume analysis has been developed since Dow’s era that will give you much further insight into the role of volume in markets.
6. A Trend is in Effect Until it Gives Definite Reversal Signals
This essentially means that the direction of the price move exists until it proves that it is moving in the opposite direction. How do we know this? This is where the whole art of trendlines, support, and resistance lines come in. If you are looking at a chart and see that the price has been consistently moving in an upward direction, then it is likely that the trend will continue until there is a clear indication that it is changing. This could be seen through a break of a support line or a resistance line being broken to the upside.
Similarly, if the price has been consistently moving downward, then it is safe to assume that this trend will continue until there is evidence of a reversal. Again, this can be seen through breaks of support or resistance lines in the opposite direction. By understanding this principle, traders can have more confidence in their trades as they are following the overall market trend.
Example of Dow Theory In Action.
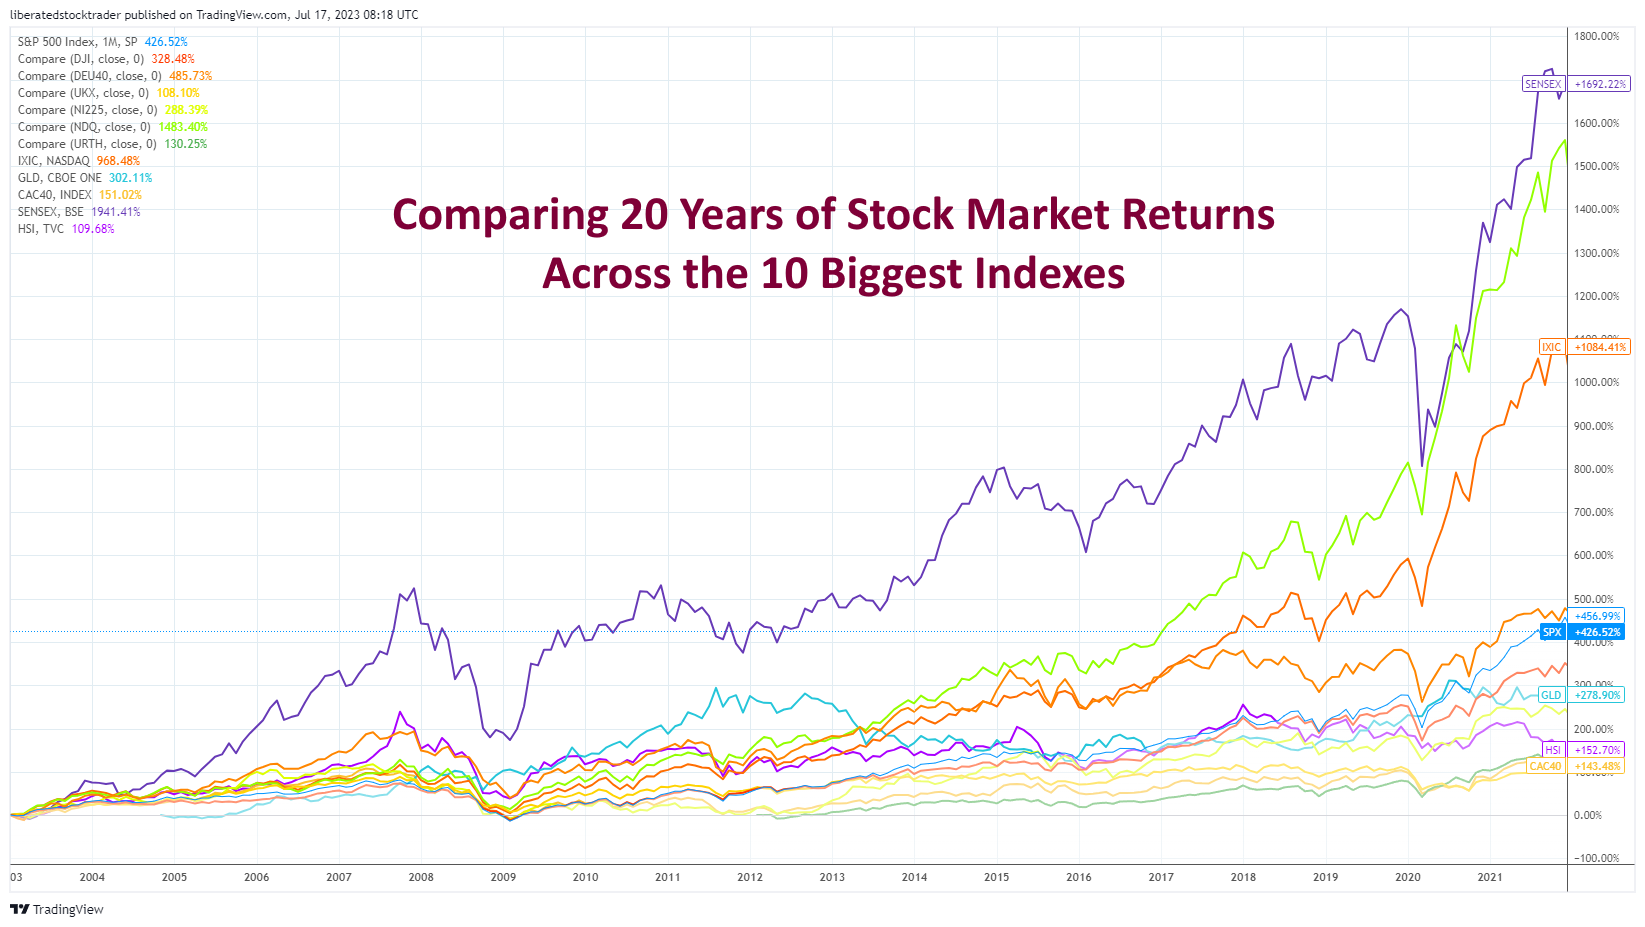
Volume is important, and a market moving up on increasing volume is healthy. A market moving down on increasing volume is a warning sign. The chart below (a historical example) shows the ten major world indexes in a line chart.
Notice how, on a grand scale, markets broadly follow a similar trend; this is what Dow called confirmation.
Forming Your Opinion on Market Direction.
To form your opinion on market direction using Dow theory, you can compare the current trend of the market with historical data and patterns. This can include analyzing previous price movements, volume trends, and breakouts or breakdowns of support and resistance levels. It is important to also take into account any economic or political news that may impact the market’s direction.
For example, if you see a strong uptrend in the S&P 500 index with increasing volume, this would align with Dow theory principles and indicate a healthy market. On the other hand, if there is a downtrend in the Nasdaq index accompanied by high-volume selling, this could indicate weakness in that particular sector.
Another important aspect of Dow’s theory is the concept of confirmation. This means that one market index should confirm the movements and trends of another index in order for a trend to be considered valid. For example, if the Dow Jones Industrial Average is experiencing an uptrend but the transportation index is showing a downtrend, this could be seen as a warning sign and may indicate a potential reversal in the overall market direction.
It’s also essential to understand that Dow theory is not a foolproof method for predicting market movements. It is simply one tool among many that can aid in your decision-making process.
Summary
Dow theory’s six principles serve as the foundation for technical analysis: The market reflects all information; it exhibits three trends and phases; the averages should validate one another; volume affirms the trend, which persists until a reversal occurs. These principles are the cornerstone of contemporary stock Technical Analysis.
See the article on Stock screening to help you find those stocks.