Barry D. Moore CFTe
406 POSTS
239 COMMENTS
With a wealth of experience spanning 25 years in stock investing and trading, Barry D. Moore (CFTe) is an author and Certified Financial Technician (Market Analyst) recognized by the International Federation of Technical Analysts (IFTA). Notably, he has also held executive positions in leading Silicon Valley corporations IBM Corp. and Hewlett Packard Inc.
7 Strategies to Find Quality Value Stocks Paying Dividends
Our research combines criteria for selecting value stocks and dividend-paying stocks to create seven strategies for finding under-valued dividend stocks. We include the exact criteria to use and a step-by-step guide to implementing them into a stock screener.
9 Best Stock Chart Types For Traders & Investors Explained
Our research shows the most effective chart types for traders are Heikin Ashi, Candlestick, OHLC, Raindrop, and Renko charts. These charts provide the best balance of price and trend reversal information to help investors build effective trading strategies.
Wyckoff Method Explained: Accumulation & Distribution Trading
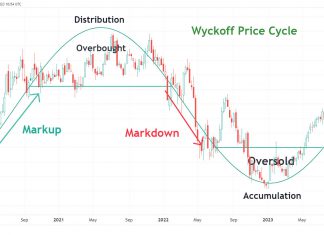
The Wyckoff Method is built upon three cardinal laws that govern the financial markets: the Law of Supply and Demand, the Law of Cause and Effect, and the Law of Effort versus Result.
55% Of Bull Flags Fail. Trade a High Tight Flag’s 85%...
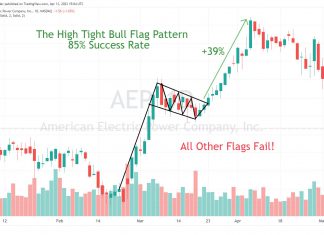
According to an analysis of 1,028 trades, most bull flags have a failure rate of 55%. The high-tight bull flag has a success rate of 85% and is the only flag pattern you should trade.
How to Trade a Descending Triangle’s 87% Success Rate
Twenty years of trading research show the descending triangle pattern has an 87% success rate in bull markets and an average profit potential of +38%.
Why Traders Should Avoid a Bear Flag Pattern Based On Data!
Be careful when trading bearish flags. According to published research, the bear flag pattern has a low success rate of 45%. This means you are flipping a coin when trading this pattern, as the odds are not in your favor. The high-tight bear flag is the only flag pattern you should trade.
How to Short-Sell an Inverse Cup and Handle’s 82% Reliability
Two decades of trading research indicate that the inverse cup and handle pattern has an 82% success rate and average price drops of 17%. It is an ideal pattern for short-selling.
8 Bearish Chart Patterns for Traders Tested & Proven Reliable
Decades of research have proven the most predictable bearish chart patterns are the inverted cup-and-handle, with an average price decrease of 17%, the rectangle top (-16%), head-and-shoulders (-16%), and the descending triangle (-15%).
How to Trade a Cup and Handle’s 95% Reliability & 54%...
Twenty years of trading research show that the cup and handle pattern has a 95% success rate in bull markets and returns an average profit of +54%.
How to Trade the Inverse Head & Shoulders with 89% Accuracy
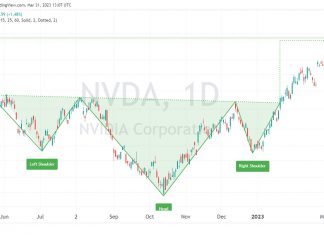
The inverse head and shoulders pattern is one of the most accurate technical analysis reversal patterns, with a reliability of 89%. It occurs when the price hits new lows on three separate occasions, with two lows forming the shoulders and the central trough forming the head.
Top 10 Best Bullish Patterns Tested & Proven Reliable
Research shows the most reliable and accurate bullish patterns are the Cup and Handle, with a 95% bullish success rate, Head & Shoulders (89%), Double Bottom (88%), and Triple Bottom (87%). The most profitable chart pattern is the Bullish Rectangle Top, with a 51% average profit.
How to Trade Market Profile Charts & Best Software To Use
A market profile chart is a day-trading tool that displays the price activity to identify a time price opportunity (TPO). It helps traders identify the most traded prices and develop strategies to exploit these areas.
Avoid Equivolume & Use These 6 Proven Charts
Equivolume charts have lost their popularity over time due to poor performance in testing and weak data visualization. I demonstrate why equivolume is no longer in use and introduce six charts proven superior by data.
How to Trade the Rising Wedge Pattern’s 81% Success Rate
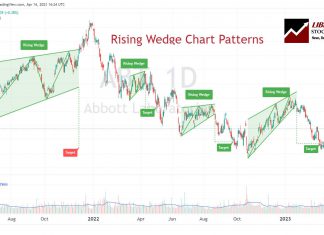
According to multi-year testing, the rising wedge pattern has a solid 81% success rate in bull markets with an average potential profit of +38%. The ascending wedge is a reliable, accurate pattern, and if used correctly, gives you an edge in trading.
Why Traders Must Avoid the Bear Pennant Pattern!
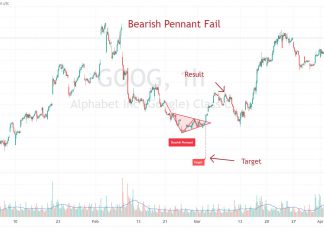
Traders should avoid using bear pennants. Decades of testing on over 1,600 trades show bearish pennants have a low success rate of 54% and a low price decrease of 6%.
How to Trade a Rectangle Pattern’s 85% Success Rate
Decades of trading research show the rectangle pattern has an 85% success rate in bull markets and an average profit potential of +50%.
The Best Free Point & Figure Charts & How To Trade...
Point and Figure (P&F) charts are a unique form of technical analysis that focuses solely on price action, disregarding time and volume. They utilize 'Xs and 'Os to depict price movements, with 'X' representing an increase and 'O' a decrease.
Renko Charts Trading Strategy: Best Settings Based On Data
Renko charts filter out unnecessary price fluctuations to provide a clear stock price trend that traders can use in their investing strategies. Unlike a traditional bar or candlestick chart, Renko charts are based on price changes rather than time.
How to Trade a Double Bottom Pattern’s 88% Success Rate
Decades of research reveal the double bottom pattern has an 88% success rate in bull markets and an average profit potential of +50%. The double-bottom chart pattern is one of the most reliable and accurate chart indicators in technical analysis.
Head & Shoulders Pattern: Trade an 81% Success Rate
The head and shoulders pattern is one of the most accurate technical analysis reversal patterns, with a reliability of 81%. A head and shoulders top occurs when the price peaks on three separate occasions, with two peaks forming the "shoulders" and the central peak forming the head.


