There are two ways to analyze stocks. Fundamental analysis evaluates criteria such as PE ratio, earnings, and cash flow. Technical analysis involves studying charts, stock prices, volume, and indicators. Both methods provide valuable insights for investors.

Analyzing Stocks with Fundamental vs. Technical Analysis
There are two essential methods to analyze stocks. Long-term investors use fundamental analysis of a company’s financial statements, such as earnings, sales, dividends, and future cash flow valuations. Stock Traders use the technical analysis of stock charts, prices, patterns, and supply and demand using volume indicators.
We will start by looking at fundamentally analyzing a stock and then move on to the technical analysis of stocks.
Video: Analyzing Stocks with Fundamental & Technical Analysis
Video From The Liberated Stock Trader Pro Masterclass Course
How to Analyze a Stock Using Fundamental Analysis
What is Fundamental Analysis of Stocks?
The fundamental analysis of stocks analyzes the foundation of a company’s financial operations. Typically, fundamental analysis helps you answer the following questions:
- Is the company profitable?
- Is the company growing sales?
- Is the company paying dividends?
- Is the company stock cheap or expensive?
- Does the company have a healthy cash flow?
- Is the company efficient?
Video: The Pros & Cons of Fundamental Analysis of Stocks
How to Analyze Growth Stocks
Analyzing growth stocks involves using criteria such as earnings, new price highs, revenue, sales, and overall equity supply and demand using volume.
Investing in growth stocks means you want to profit from stock price growth over the medium to long term. Earnings, revenue, and sales are criteria that power stock price growth.
The most famous strategy for analyzing growth stocks is using the CANSLIM method.
- C – Current Earnings – Earnings per Share (EPS) quarterly growth > 18% compared to the same quarter last year
- A – Annual Earnings – Annual Earnings per Share (EPS) 5-year average > 25%
- N – New 52-Week Price High – within 15% of the new high
- S – Supply and Demand – Shares Available (Millions) > 9
- L – Leaders – Relative Strength Index (RSI) > 69 compared to competitors
- I – Institutional Ownership – More than 35% of shares are owned by institutions.
- M – Market Direction – General market direction should be in an uptrend.
Wall Street analysts are primarily focused on these metrics. As you can see, when the quarterly earnings are announced, there is so much media coverage and hype.
How to Analyze Value Stocks
To analyze value stocks, you look for companies whose future cash flow per share is significantly higher than the current market price per share.
Value investors seek to find significantly undervalued stocks compared to the stock price. How you value a company versus the stock price is the key to this strategy.

Fair Value or Intrinsic Value
The Intrinsic Value of a stock is an estimate of a stock’s value without regard for the stock market’s valuation. There are many ways to calculate an intrinsic value, which you can read about in the article How to Calculate the Intrinsic Value of a Stock [Buffett Style].
Warren Buffett calculates the Fair Value/Intrinsic Value of a company based on the amount of cash flow it is estimated to generate over the next ten years.
You want to be a successful stock investor but don’t know where to start.
Learning stock market investing on your own can be overwhelming. There’s so much information out there, and it’s hard to know what’s true and what’s not.

Liberated Stock Trader Pro Investing Course
Our pro investing classes are the perfect way to learn stock investing. You will learn everything you need to know about financial analysis, charts, stock screening, and portfolio building so you can start building wealth today.
★ 16 Hours of Video Lessons + eBook ★
★ Complete Financial Analysis Lessons ★
★ 6 Proven Investing Strategies ★
★ Professional Grade Stock Chart Analysis Classes ★
Margin of Safety
The margin of safety is all about reducing the risk of an investment. The bigger the discount you can get when buying shares in a company, the less risk you have.
If a stock price is significantly below the actual fair value of a company, that percentage difference is known as the Margin of Safety. The margin of safety is the percentage that the stock market undervalues a company.
In other words, the Margin of Safety is the percentage difference between a company’s Fair Value per share and its actual stock price. If a company has profits and assets that outweigh a company’s stock market valuation, this represents a Margin of Safety for the investor. The higher the margin of safety, the better.
Value Investing Mastery: A Complete Strategy Workbook +eBook/pdf
How to Analyze Income & Dividend Stocks
When analyzing dividend stocks, you look for companies that pay a regular income through dividend payments, a sustainable dividend yield, and a good payout ratio.
How To Analyze A Stock for a Dividend Strategy
If you want to ensure that the dividends you are banking on are safe, you should look for additional factors to help support the notion that you will continue to receive dividends in the future.
Look for higher capitalized companies, preferably above $2 billion. Lowering your dividend yield expectations to greater than 1.5% will enable sustainable dividends to appear in your scan. You might also want to drop your 1-year dividend change, 3-year, and 5-year dividend average criteria to >0%. This ensures they are paying a dividend over the long term.
How to Find the Best Dividend Growth Stocks: 5 Step Strategy
Also, ensure your stocks are floated on a major (well-regulated) exchange like the LSE, DAX, NYSE, or NASDAQ.
In addition, you may want to drop your payout ratio criteria to <50 to ensure that the company is not already paying out too much in relation to its earnings.
Finally, you will want to ensure that the company is experiencing sales growth above the dividend averages or growth. This is additional insurance, so you know sales are growing; therefore, there should not be an impact on dividends in the future.
8 Criteria to Find Stocks for a Dividend & Income Strategy
- Market Capitalization > $2000 M
- Dividend Yield > 1.5%
- Dividend 1 Year Change % > 0%
- Dividend 3-Year Average % > 0%
- Dividend 5-Year Average % > 0%
- Stock3-Year major exchange (not OTC)
- Payout Ratio > 30 and < 50
- Sales Growth 5 Yr Avg > 4.5%
10 Ways to Analyze a Stock Financially
The important criteria in analyzing stocks financially are enterprise value, PE ratio, Shiller PE, price to book value, debt to equity, current ratio, quick ratio, and solvency ratio.
- Enterprise Value – The enterprise value is the company’s total value, including market capitalization. Enterprise value is the price another company could pay for a corporation. A classic formula to calculate enterprise value is market capitalization plus assets plus cash and equivalents minus debt.
- Earnings Power Value – Popularized by value investor Bruce Greenwald and considered an improvement over Discounted Cash Flow (DCF) models because it avoids speculative assumptions about future growth. The seven-step formula for EPV excludes future growth and growth cap expenses, assuming that future earnings will be like the historical average.
- PE Ratio – The Price / Earnings Ratio helps you identify companies with lower PE Ratios than competitors with similar growth prospects. The PE Ratio is only useful when comparing competitors in the same industry with similar business models. Criteria: PE Ratio < 4th decile in the industry segment
- Shiller PE Ratio – The Shiller P/E ratio or Cyclically Adjusted PE Ratio (CAPE Ratio) uses the 10-year inflation-adjusted average earnings to compute a P/E ratio that spans the typical business cycle. Criteria: Lower is better.
- Price / Book Value – To a classical value investor, book value appraises all a company’s assets. A good definition of book value is anything the company can sell for cash now. Book value assets include real estate, equipment, inventory, accounts receivable, raw materials, investments, cash assets, intellectual property rights, patents, etc. Price to book value compares a stock’s market value to the value of total assets minus total liabilities (book value). This is also known as P/B or PB. A low P/B ratio could mean that the stock is undervalued. However, it could also mean something fundamentally wrong with the company. Criteria: Lower is better
- Price / Tangible Book Value – Compares a stock’s market value to the value of total assets minus total liabilities and intangibles. A low ratio could mean that the stock is undervalued. However, it could also mean something fundamentally wrong with the company. Criteria: Lower is better
- Debt / Equity – Debt/Equity is sometimes called D/E, Financial Leverage, or Gearing and is the ratio of Total Debt to Equity. Criteria: A high ratio indicates a risky business and a low ratio makes a buyout more likely.
- Current Ratio – A measure of the company’s ability to pay short-term obligations, calculated as current assets divided by current liabilities. Criteria: safe investments have a current ratio > 2.
- Quick Ratio – Quick ratio is also called acid-test or liquid ratio, and it measures a company’s ability to meet its short-term obligations with its most liquid assets. It is calculated as (Current Assets – Inventory) / Current Liabilities. Criteria: safe investments have a quick ratio < 1.
- The Solvency Ratio – measures whether a company generates enough cash to stay solvent. It is calculated by summing net income and depreciation and dividing by current liabilities and long-term debt. Criteria: A value above 20% is considered good.
The Best Software for Analysing Stocks
Only one stock screener and analysis platform on the market will enable you to flexibly implement all of the dividend investing strategies detailed in the next section.
The best tool for the job is Stock Rover, the Winner of our Top 10 Best Stock Screeners Comparison. Also, Stock Rover won our Best Value Investing Stock Screener.
Option 1 – Get Stock Rover – For USA & Canadian Investors
Sign Up For A Free 14-day trial of Stock Rover (no card required); this will give you the Premium Plus Service for 14 days. You need the Premium Plus Service to access the remarkable 10-year dividend history, Fair Value, and Margin of Safety criteria exclusive to Stock Rover.
Option 2 – Get TradingView – For International Investors
Suppose you plan to build a portfolio of dividend stocks outside of the USA & Canada. In that case, the best option is TradingView, which provides detailed value and dividend stock screening for nearly every stock on the planet. Easy to use yet powerful, TradingView is excellent for international investors.
The Results of Analysing Stocks for Value Investing
Using the above methodologies and a great stock screener, you can generate a list of great stocks to invest in, and most of the analysis is done for you.

Video: How to Analyze Stocks
How to Analyze a Stock Using Technical Analysis
What is the Technical Analysis of Stocks?
For the short-term stock trader, technical analysis is the key to success. Technical analysts evaluate the exchange’s supply and demand dynamics in stock trading to predict future price moves. The stock price, the number of buyers and sellers, and the traded stock volume are the three main factors. These three factors are visualized as stock charts, indicators, patterns, and trends.
Video: The Pros & Cons of Technical Analysis of Stocks
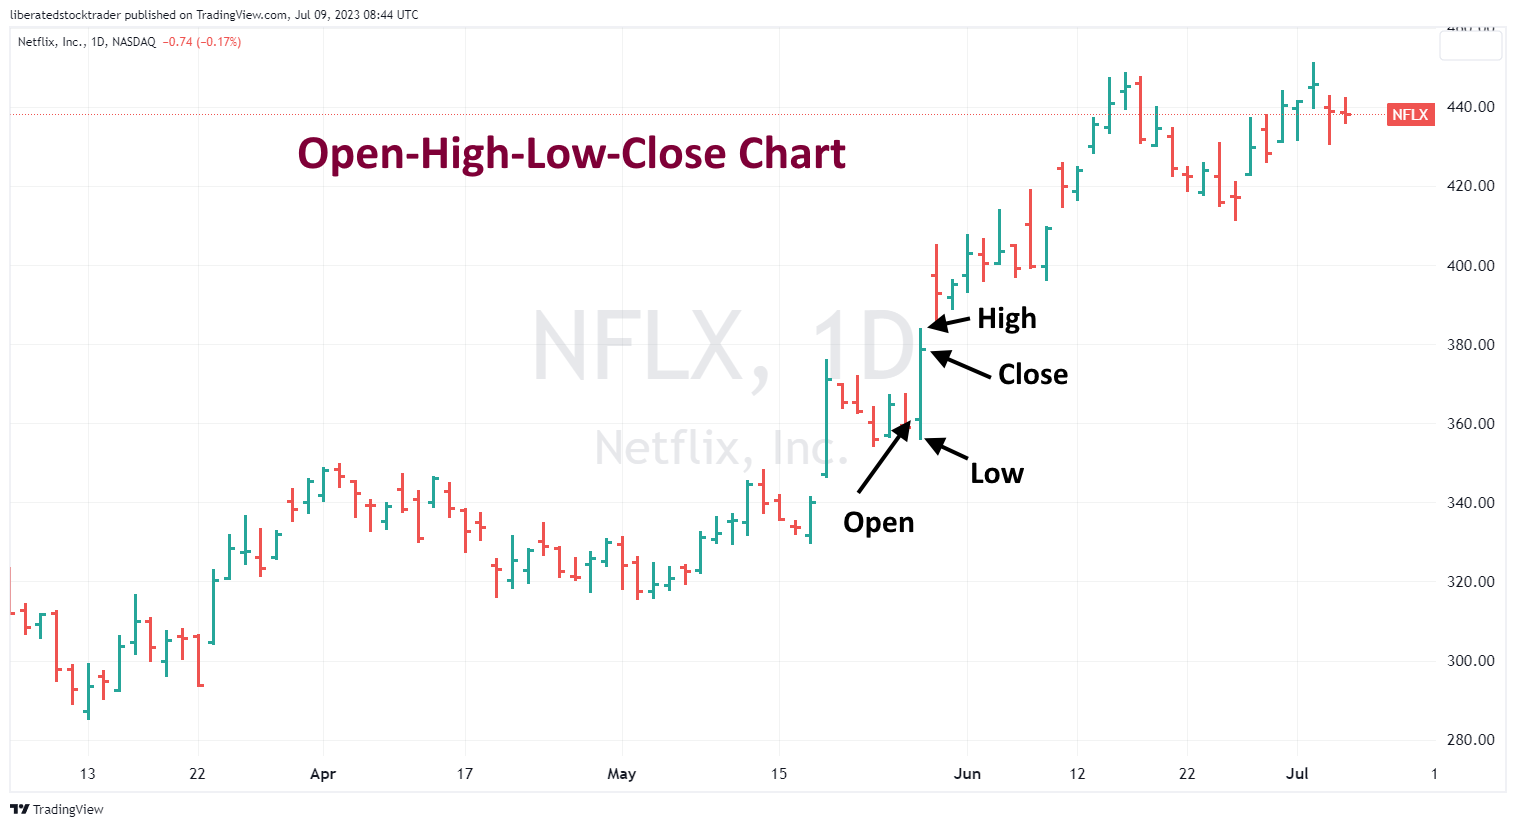
How to Understand a Stock Chart
Here, we have an OHLC (Open, High, Low, Close) stock chart. As you can see, the stock price moves up and down. The green bar indicates that the stock price has gone up, and the red bar indicates it has gone down. By looking at the chart, you can determine whether the trend is bullish (upward) or bearish (downward).
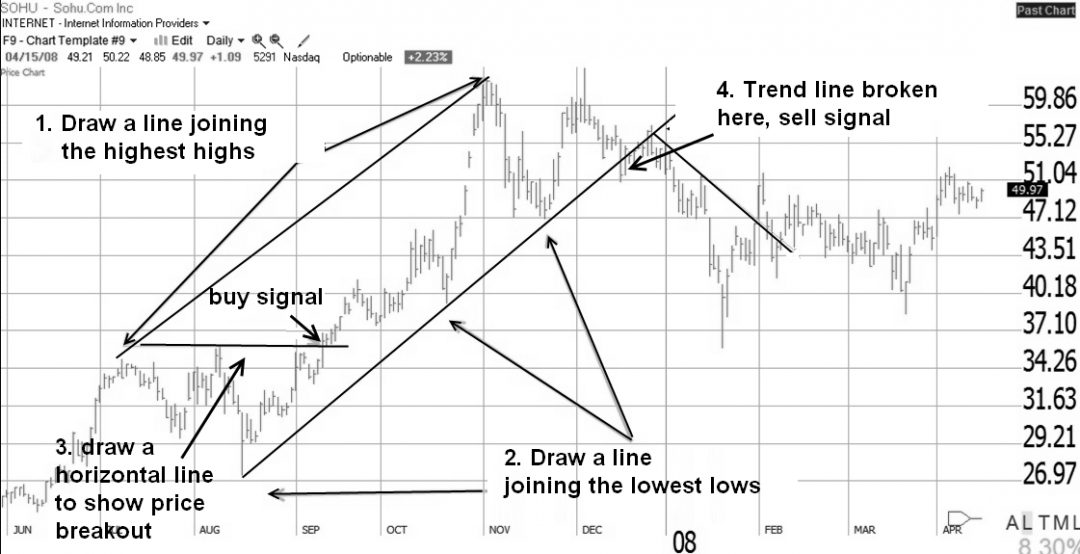
Stock Price & Trend Analysis
You often see support and resistance lines drawn by someone else or automatically by a stock chart indicator on charts. This is a chart of Apple Inc (Ticker: AAPL), which shows various trend lines in a downward and upward price move.
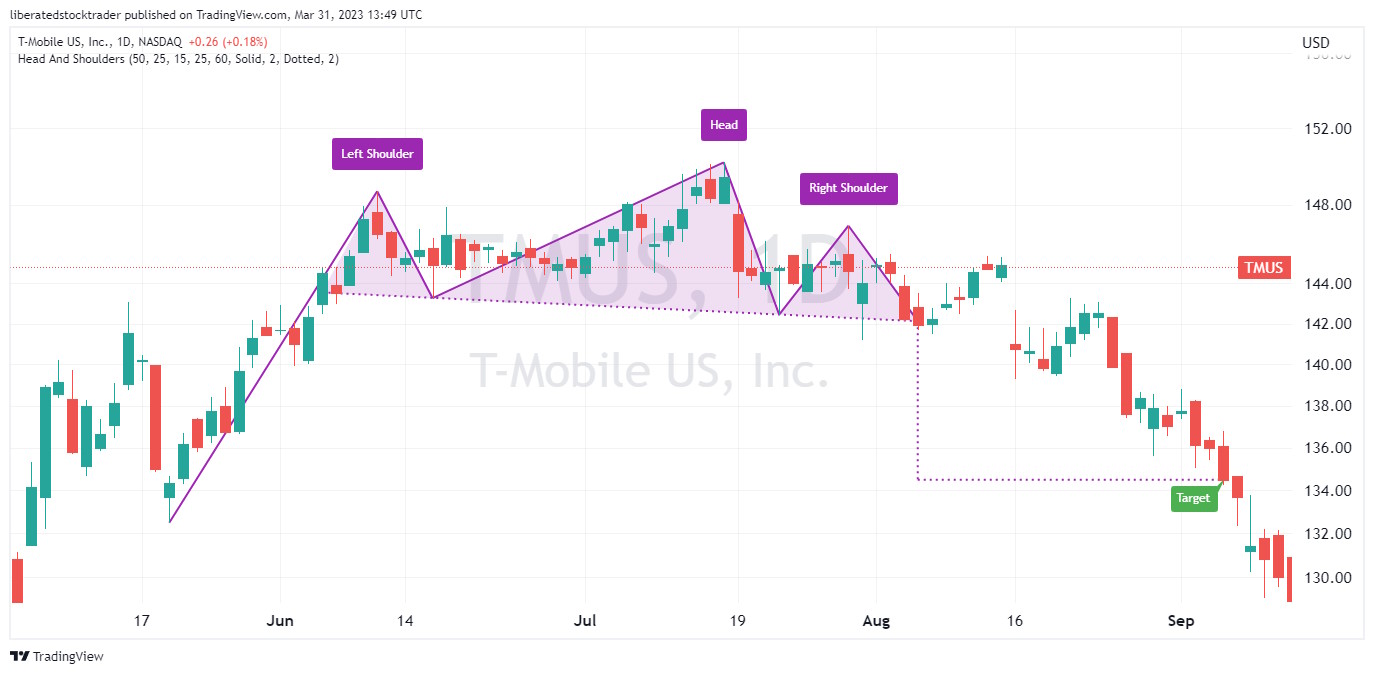
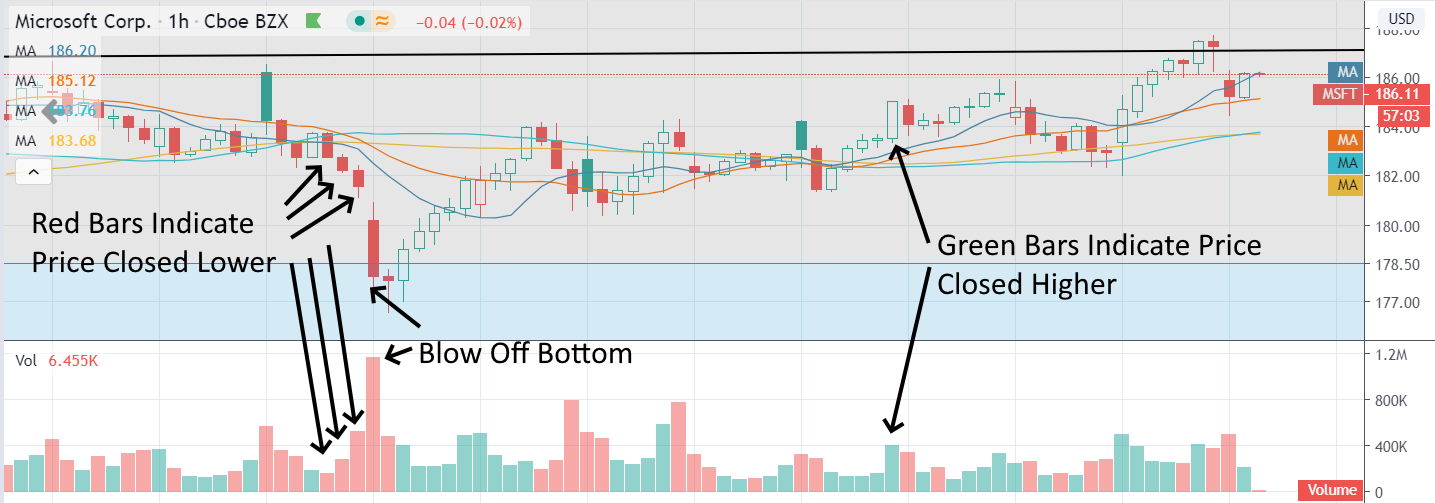
Using the Price Volume Relationship to Analyze a Stock
Using stock chart patterns to analyze a stock primarily represents volume and price. Here is an excellent example of one of the most popular stock chart patterns, the “Head & Shoulders.” Here, you can see and understand the relationship between the supply and demand of the stock.
There are some crucial characteristics of volume and price in the stock market.
Price Up–Volume Up (PUVU): The price increases on increased volume. This is bullish as it shows us that more participants are interested in selling the stock at higher prices and that, most importantly, more people are interested in buying it at higher prices. In an uptrend, this signals the trend will continue; in a downtrend, this indicates a possible correction or change in the trend’s short-term direction to upwards.
Price Up-Volume Down (PUVD) in an uptrend is bearish as it suggests that although prices rise, fewer participants suggest people are backing away from the higher prices. This also infers that the trend is weakening. In a downtrend, it indicates a continuance of the downtrend.
Price Down–Volume Up (PDVU) in a downtrend may signal that a change in trend is likely. This may indicate a crisis, panic selling, or simply when a stock is going out of favor in an uptrend. The pressure is on the sell side, and they have to accept lower prices to sell. A strong negative signal!
Price Down–Volume Down (PDVD) in a downtrend can suggest that the retreat is slowing or beginning to end as fewer people are interested in buying or selling the stock at these prices. In an uptrend, this may indicate the stock is stopping for a breath or due to a pullback before continuing on its upward trajectory. Volume tends to trend in the same direction as the price trend. Hence, PDVD also suggests a continuation of the primary downtrend or a pullback and a possible continuation of an uptrend.
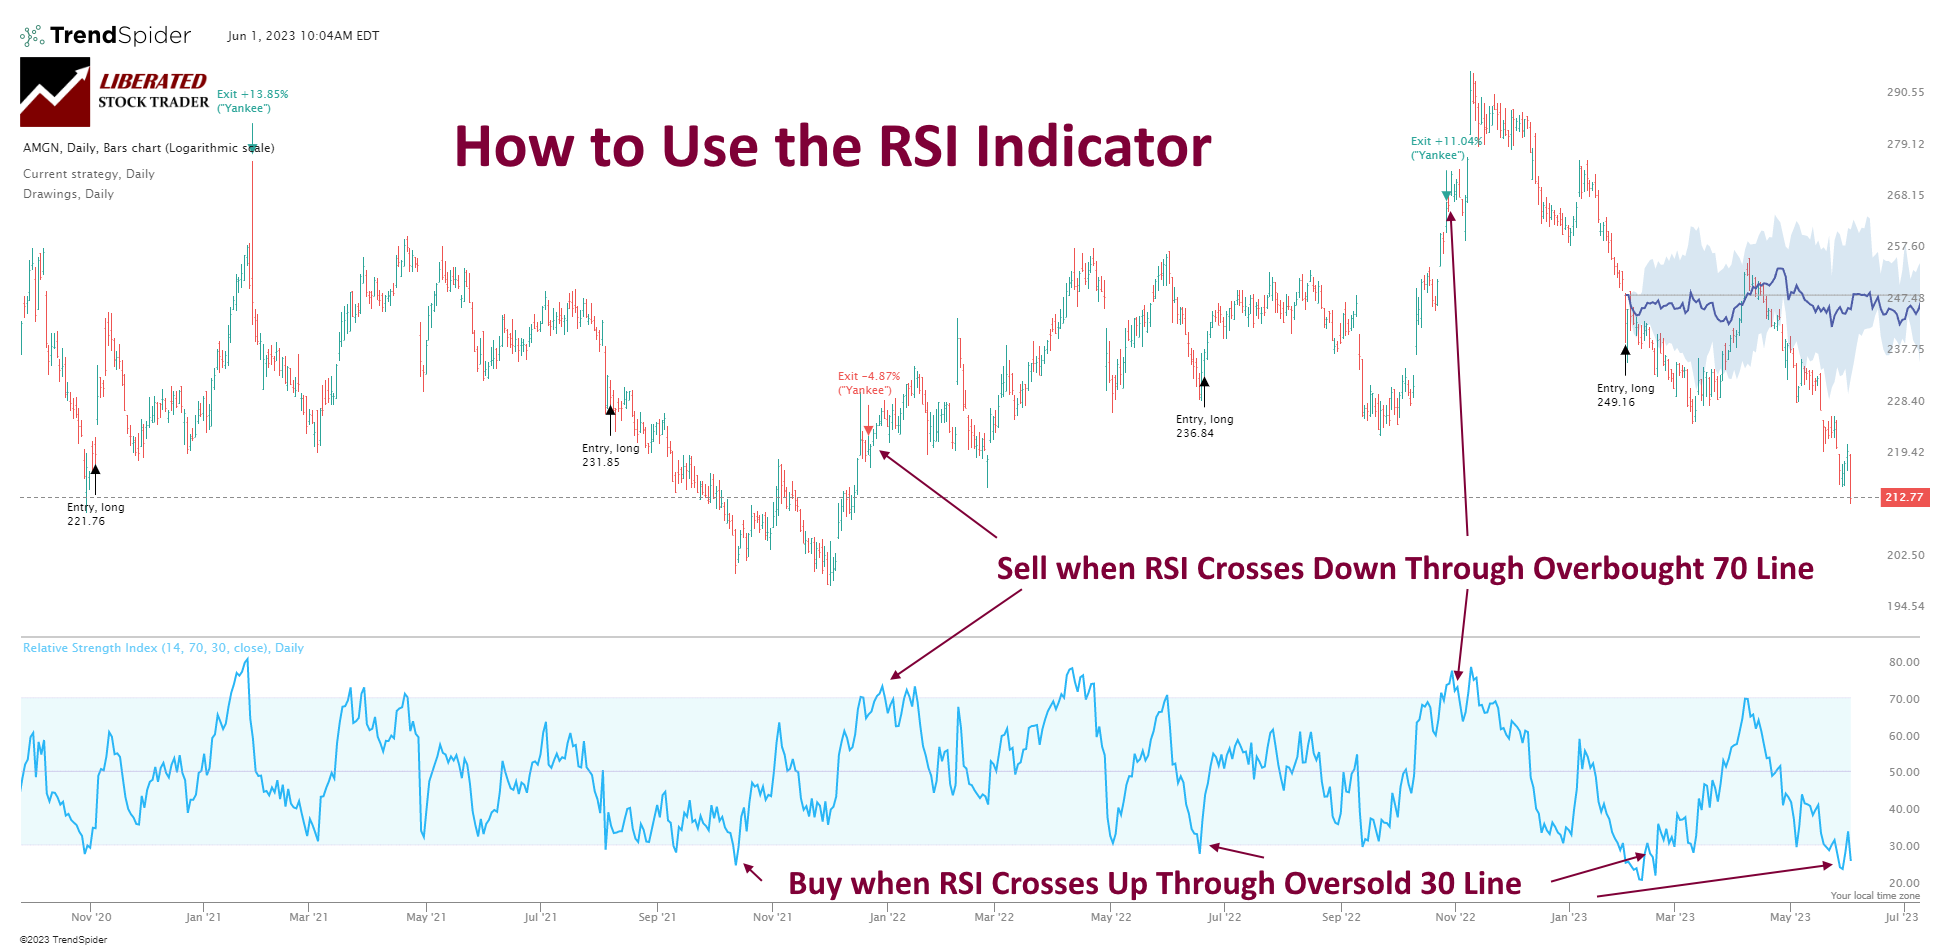
Using RSI to Analyze a Future Stock Price Move
Here, we have a popular indicator called the Relative Strength Index or Wilders RSI. Developed by J Welles Wilder, this indicator measures the strength of any stock by using its average net up closing day prices by its average net down closing prices for the period set.
RSI fluctuates between O and 100, 0 is oversold, and 100 is overbought. It is a leading indicator and can be used to predict future trend changes using positive or negative divergences compared to price.
Divergences are one of the most powerful ways to use most indicators. The fact that it is a leading indicator, as opposed to moving averages, which are lagging, can thus indicate future directional changes.
How to Analyze Stock Summary
There are many ways to analyze a stock. How you analyze a stock depends on whether you are a short-term trader or a long-term investor. As a trader, you will use the technical analysis of stock charts to analyze future stock price movements. As a long-term investor, you will use fundamental analysis to analyze a company’s value or income potential.
Related Articles: Finding Great Stocks With Stock Rover
- 12 Legendary Strategies to Beat the Market That [Really] Work
- Our Beat the Market Screener [Actually] Beats the Market
- 4 Easy Steps to Build The Best Buffett Stock Screener
- 6 Steps to Build an Ethical ESG Investment Portfolio
- All Value Investing Strategies & Articles
- Use a CANSLIM Stock Screener Strategy To Beat the Market


