8 Steps to Build a Balanced & Profitable Portfolio
To build a balanced investment portfolio, determine how much to invest, your risk tolerance, portfolio allocation, and your investing strategy. Next, choose the right tools to screen and research the ideal stocks and ETFs to enable you to manage your portfolio effectively.
13 Epic Stock Portfolio Examples to Master Investing
Our years of performance testing reveal the world's best-performing stock portfolios are Berkshire Hathaway, CANSLIM, GreenBlatt's Magic Formula, and the FAANG portfolio. We share examples and show you how to implement them.
Can You Buy DeepSeek Stock? Ownership and Opportunities
DeepSeek has emerged as a major player in the artificial intelligence landscape, challenging established tech giants with its innovative AI models. The Chinese startup,...
7 Steps to Managing Your Stock Portfolio Like a Pro
Managing a stock portfolio entails seven crucial tasks: conducting research, analyzing performance, rebalancing holdings, assessing correlations, planning future income, optimizing tax benefits, and analyzing future performance.
12 Legendary Market Beating Strategies Worth Trying
To consistently beat the market is difficult but not impossible. O'Neill, Greenblatt, Buffett, and Klarman are legendary investors who have beaten the market. I test the strategies and show you the best ways to implement them.
Find Hidden Alpha: Expert Stock Picking Guide
Alpha measures a stock, fund, or asset's performance relative to its benchmark. It is often expressed as a percentage. For example, if an investment increases in value by 10 percent but the market benchmark increases by 5 percent, then the alpha would be +5%.
Putting CANSLIM to the Test: Does This Strategy Work?
CANSLIM is an active investment strategy that utilizes specific screening criteria such as earnings, market leadership, product innovation, institutional ownership, and stock price trends. These key criteria play a vital role in the process of stock selection.
Which is Better Value or Growth Stocks? I Test The Data!
Our data analysis for the past decade shows that growth stocks have outperformed value stocks. Growth investing has shown a remarkable return rate of 523%, while value investing has yielded 247%.
5 Smart Ways To Find & Invest In The Best Blue...
A blue-chip stock is a well-established, financially sound company with an excellent track record of strong performance. Blue chips are large companies in mature industries that pay regular dividends. Examples of blue-chip stocks include Apple, Microsoft, Boeing, Coca-Cola, IBM, and Visa.
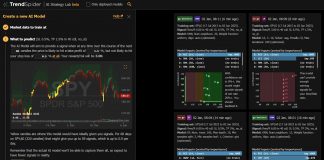
How to Train Powerful Custom AI Trading Models
While platforms like TradingView and Trade Ideas offer many algorithms, only TrendSpider lets you fully train your own models. It’s a game-changer for traders looking to create unique strategies!
2025 Investment Outlooks: What Wall Street Predicts
Wall Street's predictions are usually dominated by standard forecasts about growth and inflation. But for 2025, there’s one factor no one can ignore —...
TrendSpider Review 2025: Is Its AI & Automation Worth It?
My testing awards Trendspider 4.8/5 stars due to its innovation. Its powerful algorithms recognize trendlines, chart patterns, and candlesticks automatically. It also has automated trading bots, real AI LLMs, and powerful point-and-click back-
testing.
13 Great Ways to Learn Stock Trading Fast & Free
I believe the best ways to learn stock trading include books, audiobooks, data-backed analytical research, and reputable investing courses taught by industry-certified instructors.
10 Best Stock Trading Technical Analysis Software of 2025
My in-depth testing shows that TradingView, TrendSpider, and Trade Ideas are the best tools for traders, and Stock Rover is superior for investors. Each provides unique benefits, features, and price points.
21 Gifts for Stock Traders They’ll Totally Love
Are you looking for that perfect gift for the stock trader in your life? Our curated list of 21 gifts for traders provides inspiration for any special occasion.
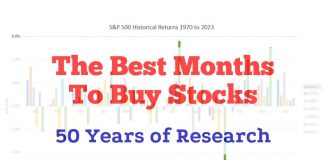
Best Month to Buy Stocks: 53-Year Market Analysis
According to our research, using 53 years of stock exchange data, the best time to buy stocks is in October, and the best time to sell stocks is in July.
Trading the Santa Claus Rally Based on 31 Years of Data...
Based on our data analysis, the Santa Rally phenomenon is indeed observable. Our findings indicate average stock price rises of 1.74% in October, 2.40% in November, and 0.56% in December.
Black Friday Stock Trading Deals All Year Long
Our verified stock trading software Black Friday partner discounts are live for TradingView -70%, TrendSpider -67%, MetaStock -50%, Trade Ideas -25%, and Stock Rover -30%.
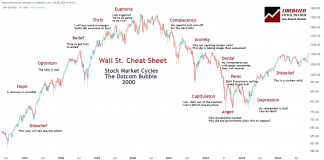
Master the Market With Our Free Wall Street Cheat Sheet
Our Wall Street Cheat Sheet is a roadmap for navigating the emotional highs and lows investors face during market cycles. Each phase reflects a collective sentiment that can influence financial markets and, subsequently, stock price movements.
Should You Buy the Rumor and Sell the News? Does it...
"Buy the Rumor, Sell the News" means being one step ahead of other traders by reading the price and volume action leading up to a news or earnings announcement.

