TradingView vs. MetaTrader Test: Which One Wins?
MetaTrader and TradingView are fundamentally different platforms. MetaTrader excels as a robust desktop-based trading automation and execution platform. TradingView shines as a social-oriented analytical powerhouse with superior charting, indicators, backtesting, and data coverage.
7 Defense Stocks Ready to Boom with Trump’s NATO Reforms
My analysis shows that Palantir, Lockheed Martin, Northrop Grumman Corp, Rheinmetall, and Raytheon Technologies stand to gain from Trump's push for NATO allies to increase defense spending.
9 AI Stocks Ready to Boom with Project Stargate
My research shows that Companies like Nvidia, Palantir, Oracle, and Microsoft are well-positioned to make substantial gains from Project Stargate, given their expertise in hardware and cloud computing solutions.
Are Stocks at Risk? Trump’s Tariffs Explained
Stocks are at risk in 2025 and beyond if the full impact of tariffs is felt. The most recent example of Trump tariffs in the market was in 2018 when we saw increased market volatility and a 20% drop in the S&P 500. It took 18 months for the market to recover.
Trump’s Tariffs: Investor Impacts in US, EU and Canada
The Trump administration is using tariffs to leverage the US' financial might to reshape politics, power, and trade globally. Combined with overtures of an imperial land grab in Greenland and Panama, this is an uncertain time for markets.
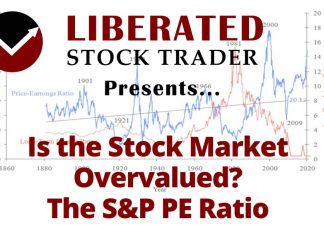
Is The Stock Market Overvalued? The Data Says Yes!
According to the Shiller PE Ratio, the US stock market is currently 19.2% overvalued compared to its 200-month moving average. Currently, the PE ratio of the S&P 500 is 31, and the 10-year average is 26.
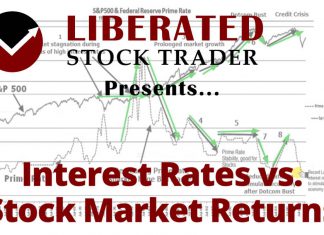
60 Year Analysis Shows How Interest Rates Affect Stocks
Interest rates significantly impact the stock market. Low rates mean cheap money for businesses and consumers, boosting demand for goods and services. This drives up companies' profits and stock prices. Conversely, rising rates make borrowing costlier, reducing spending and causing stock prices to fall.
Stock Market Crashes: History, Causes & Effects
Our research shows that asset bubbles, easy access to cheap credit, weak regulation, and poor institutional risk management are the causes of crashes.
Invest Better with Two Systems Theory of Behavioral Finance
The two systems theory posits that our brains use two distinct cognitive processes: System 1 (fast, intuitive, and emotional) and System 2 (slow, deliberate, and logical).
8 Steps to Build a Balanced & Profitable Portfolio
To build a balanced investment portfolio, determine how much to invest, your risk tolerance, portfolio allocation, and your investing strategy. Next, choose the right tools to screen and research the ideal stocks and ETFs to enable you to manage your portfolio effectively.
13 Epic Stock Portfolio Examples to Master Investing
Our years of performance testing reveal the world's best-performing stock portfolios are Berkshire Hathaway, CANSLIM, GreenBlatt's Magic Formula, and the FAANG portfolio. We share examples and show you how to implement them.
Can You Buy DeepSeek Stock? Ownership and Opportunities
DeepSeek has emerged as a major player in the artificial intelligence landscape, challenging established tech giants with its innovative AI models. The Chinese startup,...
7 Steps to Managing Your Stock Portfolio Like a Pro
Managing a stock portfolio entails seven crucial tasks: conducting research, analyzing performance, rebalancing holdings, assessing correlations, planning future income, optimizing tax benefits, and analyzing future performance.
12 Legendary Market Beating Strategies Worth Trying
To consistently beat the market is difficult but not impossible. O'Neill, Greenblatt, Buffett, and Klarman are legendary investors who have beaten the market. I test the strategies and show you the best ways to implement them.
Find Hidden Alpha: Expert Stock Picking Guide
Alpha measures a stock, fund, or asset's performance relative to its benchmark. It is often expressed as a percentage. For example, if an investment increases in value by 10 percent but the market benchmark increases by 5 percent, then the alpha would be +5%.
Putting CANSLIM to the Test: Does This Strategy Work?
CANSLIM is an active investment strategy that utilizes specific screening criteria such as earnings, market leadership, product innovation, institutional ownership, and stock price trends. These key criteria play a vital role in the process of stock selection.
Which is Better Value or Growth Stocks? I Test The Data!
Our data analysis for the past decade shows that growth stocks have outperformed value stocks. Growth investing has shown a remarkable return rate of 523%, while value investing has yielded 247%.
5 Smart Ways To Find & Invest In The Best Blue...
A blue-chip stock is a well-established, financially sound company with an excellent track record of strong performance. Blue chips are large companies in mature industries that pay regular dividends. Examples of blue-chip stocks include Apple, Microsoft, Boeing, Coca-Cola, IBM, and Visa.
How to Train Powerful Custom AI Trading Models
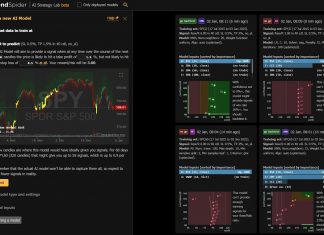
While platforms like TradingView and Trade Ideas offer many algorithms, only TrendSpider lets you fully train your own models. It’s a game-changer for traders looking to create unique strategies!
2025 Investment Outlooks: What Wall Street Predicts
Wall Street's predictions are usually dominated by standard forecasts about growth and inflation. But for 2025, there’s one factor no one can ignore —...

