Home Blog
How to Take Advantage of Qualified Dividends
Investors need to ensure that the stocks they hold meet specific criteria set by the IRS to take advantage of qualified dividends. These criteria include holding the stock for 60 days for common stock and 90 days for preferred stock.
Understanding Preferred Stock Dividends
Preferred stock dividends are a form of payment made to preferred stock shareholders. Preferred stock is a type of ownership in a company granting privileges such as priority over common stockholders in the event of bankruptcy or liquidation.
Master Technical Analysis: A 14-Video Ultimate Guide
Our ultimate guide to technical analysis will fast-track your knowledge with our 14 videos covering charts, trends, indicators, patterns, and tools.
10 Best AI Stock Trading Bots & Apps Tested 2024
Our research identifies Trade Ideas and TrendSpider as the leaders in AI trading software. Trade Ideas has automated AI trading bots for stocks with a proven track record. TrendSpider has first-rate automated pattern recognition, trading, and backtesting.
Top 10 Best Stock Trading Technical Analysis Software 2024
Our testing identified the best stock trading software as TradingView for global trading and community, Trade Ideas for AI-powered bot trading, and TrendSpider for pattern recognition and backtesting.
A Financial Analyst’s Guide to Trading the Volume Indicator
Stock volume, or trading volume, is the total number of shares traded during a specific period. Volume indicates buying and selling pressure and potential changes in a stock's trend direction and quality.
Are Keltner Channels Worth Trading? Best Settings Tested
A Keltner Channel is a volatility-based trading indicator combining a simple moving average, exponential moving average, and average true range to plot a channel on a chart. It identifies trading signals using overbought and oversold conditions.
12 Ways to Master Stock Chart Indicators by a Certified Analyst
Professional market analysts build trading strategies using chart indicator techniques like divergences, multi-time frame analysis, indicator combinations, and rigorous backtesting.
Advance/Decline (A/D) Line Explained by a Certified Analyst
The advance/decline (A/D) line indicator measures market breadth by identifying how many stocks participate in a market advance or decline. It is calculated by taking the number of advancing stocks minus the declining stocks.
5 Moving Average Indicators Tested on 43,770 Trades
The best moving average settings are SMA or EMA 20 on a daily chart, which achieves a 23% win rate. At settings 50, 100, and 200, it is better to use the Hull moving average, which has win rates of 27%, 10%, and 17%, respectively.
MACD Strategy & Reliability Tested by LiberatedStockTrader
MACD is a trend-following momentum indicator used to identify price trends. We conducted 606,422 test trades to find the best settings and trading strategies.
Is the S&P 500 200-Day Moving Average Profitable? I Test It!
Our testing of the 200-day MA on the S&P500 over 16 years revealed that using this indicator is a losing proposition. A buy-and-hold strategy made a profit of 192% vs. the 200-day MA, which made only 152%.
Best Commodity Channel Index (CCI) Settings Tested on 43,297 Trades
Our test data shows that using the CCI indicator with a 50 setting on the S&P 500 index stocks over 20 years was incredibly profitable, returning a 1,108% profit compared to the market, which returned 555%.
7 Parabolic SAR Trading Strategies Tested by LiberatedStockTrader
The Parabolic Stop and Reverse (PSAR) technical indicator identifies asset price reversals. Relying on parabolic time/price systems it creates effective trailing stop-losses for trading signals.
Bollinger Band Trading Strategies Tested by LiberatedStockTrader
Our reliability testing of Bollinger Bands on the S&P 500, using 13,360 years of data, suggests it is an unreliable, unprofitable indicator for traders. However, Bollinger Bands can be profitable, but you need to know how it works, how to trade it, and the optimal settings.
Top 10 Reliable Candle Patterns: 56,680 Trades Tested
Our 56,680 test trades show the most reliable candlestick formations are the Inverted Hammer (60% success rate), Bearish Marubozu (56.1%), Gravestone Doji (57%), and Bearish Engulfing (57%).
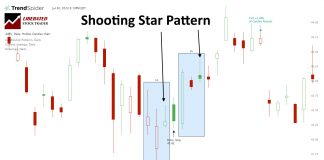
1,680 Trades Test the Shooting Star Candle’s Reliability
Based on 568 years of data, our research shows the Shooting Star candle is bullish, not bearish, as most traders believe. It has a 57.1% upside success rate and an average winning trade of 3.6%. Each trade made using a shooting star nets an average of 0.56% profit.
Trade Ideas Review 2024: AI Tested by LiberatedStockTrader
Our in-depth testing shows Trade Ideas is the ultimate black box AI-powered day trading signal platform with built-in automated bot trading. Three automated Holly AI systems pinpoint trading signals for day traders.
Rate of Change Indicator Test: Trading a 66% Success Rate
The Rate of Change (ROC) is a momentum indicator that measures the speed and direction of asset price movements. It helps traders determine whether a security is trending and how quickly its price changes.
MetaStock Review 2024: Tested by LiberatedStockTrader
Our MetaStock review and test reveal an excellent platform for traders, with 300+ charts and indicators for stocks, ETFs, bonds & forex globally. Metastock has solid backtesting and forecasting, and Refinitiv/Xenith provides powerful real-time news and screening.


