The stock market strategy blueprint is a handcrafted process to help you understand all the factors at play in the stock market.
I think you will agree that investing in the stock market can initially seem incredibly complicated. People discuss fundamentals, charts, mindset, stock selection, patterns, backtesting, and screening.
The primary purpose of the Stock Market Profits Blueprint is to put it all in perspective.
Welcome to the Stock Market Strategy Blueprint.
This series starts by breaking a few myths about how the market operates and, most importantly, provides a blueprint of how to structure a successful investment strategy.
The stock market profits blueprint has been handcrafted to enable you to understand all the factors at play in the stock market. It is called a blueprint because a blueprint is, in effect, an architectural document to show how something is designed.
One Blueprint To Rule Them All
This blueprint will show you a powerful way to envisage how many factors impact the stock market and investors. When you understand how this framework operates, you can use it to your advantage.
Are you interested in learning about a logical and structured approach to organizing your investing strategy, decision-making, and execution of investments in the stock market?
In this article, I will reveal the ultimate strategy, let’s call it a “Stock Market Profits Blueprint,” which pulls together the best of professional financial fundamental analysis and professional technical analysis of the stock markets to give you a truly usable framework to approach your market investments.
This is a very detailed study and strategy. Grab a coffee, and settle down to absorb this.
Is this Investment Strategy Blueprint better than anything professional investors use today? I believe so, but it is up to you to decide!
This work includes videos and a downloadable eBook completely free of charge. So be sure to read on to get the full impact; trust me, it is worth investing your time.
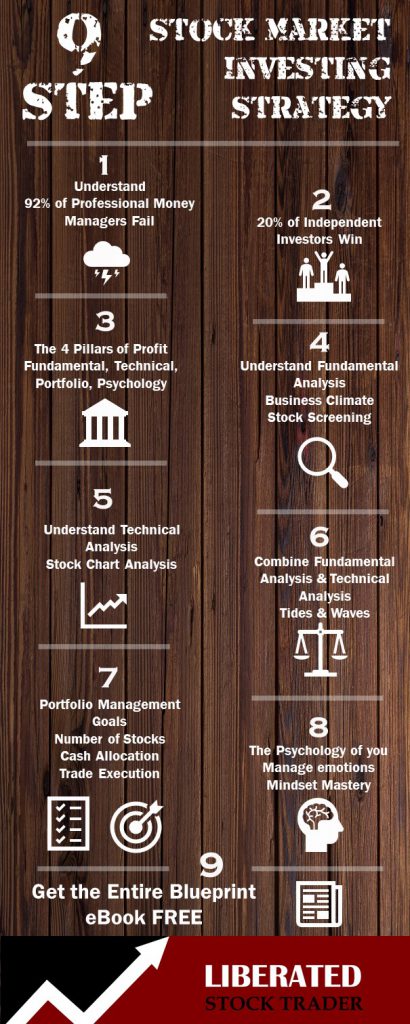
The Stock Market Investing Strategy Blueprint
This series seeks to break a few myths about how the market operates and, most importantly, provides a blueprint for structuring a successful investment strategy.
The stock market profits blueprint has been handcrafted to enable you to understand the stock market. It is called a blueprint because a blueprint is, in effect, an architectural document to show how something is designed.
The blueprint will show you a powerful way to envisage how many factors impact investors and the stock market. When you understand how this framework operates, you can use it to your advantage.
Part 1 – Understand that Most Stock Market Strategies Fail
Let us establish some core facts to understand why you need a Stock Market Blueprint.
How successful are institutional investors and fund managers?
So, let us first talk about the professionals driving their sports cars, living in huge mansions, earning obscene amounts of money, and investing YOUR MONEY and pension. Surely, they must know what they are doing with their success and wealth. WRONG.
The most simplistic measure of any investor is that they should beat the market average they are investing in. That means if I am a fund manager actively investing in the S&P 500 if the S&P-500 makes a gain for the year of 5%, I should expect to make more than 5%. If I am charging my customers 1.5% to invest their money for them and inflation is running at 2%, I will need to make 9% as a minimum so my customers break even.
If I did not, the customers would have been better off investing in a non-managed fund like an Index Tracker or an ETF that follows what the index makes.
What should your Stock Market Fund Manager achieve?
Your fund manager must beat the stock market by at least the equivalent of the management fees you are charged for the services.
The Shocking Truth
Standard & Poor’s measure this performance yearly to see how well the average Funds & Fund Managers perform against the market averages. The truth is shocking!
S&P SPIVA Report Results
Only 78.68% of all US domestic funds managed to survive the last five years!
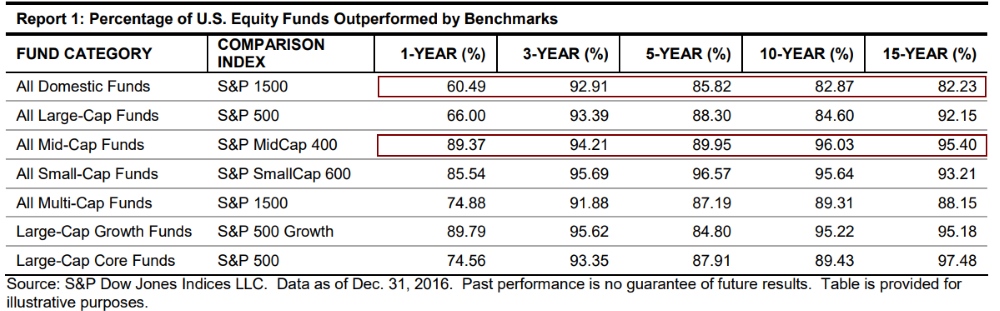
Source: https://www.spglobal.com/spdji/en/research-insights/spiva/
Here are other facts.
Almost none of the active fund managers have beaten the market over the past 15 years.
Active managers exposed as most US equity funds lag behind the market.
FACT: Most actively managed funds will lose you money compared to the market average
The average percent of equity funds performing worse than the market average:
- Over 1 year = 72%
- Over 3 year = 64%
- Over 5 years = 66%
I think you will agree when I say the odds are stacked against you. Even if you find a fund that performs well, it usually has very high fees for managing your money. This means the chances of you making any money after fees are even more remote.
FACT: Nearly 30% of managed funds are so badly managed they go bankrupt.
Here is another fascinating report from Standard & Poor dealing with survivorship. This means how many funds survive a given period. If a fund makes huge losses, it will usually be closed, and the remaining money (if any) is returned to the investors unfortunate enough to have invested.
Why do they not perform better?
The problem is many-fold.
Most institutions earn their money from a percentage of your total investment pot. Not from the money they make for you, although that is nice.
Motivation. They are trading other people’s money. Some fund managers trade their own accounts alongside the corporate account. You bet they make better returns on their private accounts.
Imagine I know I will buy 200,000 shares of ABC Corp as part of the investment fund I am managing. This will surely move the market price. Before I made this trade, I could buy 5,000 shares in ABC from my private account. They buy, with the institution’s money, the 200,000 shares. The market price moves up. I then sell my private shares for a profit. Easy!
They also have issues with the size of the trades they must make and the structure of the funds they market. Suppose they market a fund specializing in commercial real estate companies, and that sector (as we witnessed in 2009) undergoes a severe recession. In that case, they may have problems hedging their risk and limiting losses.
Normally, the independent investor should not face these issues.
Part 1 – Summary
In part 1, we have established that “professional money managers” are not beating the underlying market growth in profit. So, why would you use their services?
In Part 2, we will look at the individual stock market investors and how successful they are. What are your chances of success in the stock market?
Part 2 – Are Independent Investors Successful?
Welcome to part two in the series of the “Stock Market Profits Blueprint.” In this part, we look at the chances of success of the independent investor.
An individual investor invests in the stock market but is not affiliated with Wall Street, investment funds, trading floors, or any institution.
FACT: “Overall, about 20 percent of the investors studied were able to beat the market consistently”.
This means that 80% of investors fail to make any money in the stock market; they will tend to lose money.
This might seem hard to believe, so let me prove it.
The Research: Can Individual Investors Beat The Market?
A study conducted in 2005 study by David Hirshleifer – Professor of Finance at Ohio State University’s Fischer College of Business & Joshua D. Coval of the Harvard Business School measured the trade success on 115,856 US brokerage accounts from January 1990 through November 1996.
Source: Ohio State University
Results
Researchers found that the “top 10 percent of investors they studied earned about 38 percent above the market average per year”.
Overall, about 20 percent of the investors studied were able to beat the market consistently.
This means that 80% of investors failed to beat the market average.
Even worse, “About 10 percent of investors did extremely poorly in their choices and underperformed the market about 23 percent annually. The losses of these investors are far greater than the losses of the average individual investor.”
Other research backs this up.
“Barber and Odean (2000) note that the top-performing quartile of the individual accounts in their dataset outperform the market on average by 0.5 percent per month”.
That means 25% of traders beat the market by 0.5% annually.
How is this possible?
The study suggests that “While few would expect individual traders to be, on average, better informed than mutual fund managers, there are compelling reasons to believe that individual traders are better positioned to exploit a given informational advantage.
First, individual traders almost always trade smaller positions than professional traders. As a result, their trades’ pressure on prices is likely to be much less.
This makes them far better positioned to trade using strategies that exploit smaller or shorter-term deviations from fundamental values.
Second, individual traders are less constrained than mutual funds to hold a diversified portfolio or to track the market or a given benchmark.”
Source: https://researchnews.osu.edu
How can I be one of the top 20% of smart investors?

The key to being among the top 20% of smart, educated investors is hard work!
How to be a top 20% performer?
Here is the crunch. Those elusive stock market profits are not easy to find, as 80% of investors will attest. So we need to go and educate ourselves.
But wait, there is a little problem with that also.
Most stock market education fails to achieve what it is supposed to. Most courses fall into the Technical Analysis trap. They teach only technical analysis. This is where the Stock Market Profits Blueprint comes in. It will provide you with the entire roadmap of knowledge you need to be a top performer.
Part 3 will delve into the blueprint and introduce you to the core concepts.
Part 3 – The Stock Market Strategy Blueprint Overview
Welcome to part three in the series of the “Stock Market Profits Blueprint.” In this section, we look at the four pillars of success.
The Stock Market Blueprint will enable you to become a successful trader by providing a roadmap to understanding how the stock market really works.
Unlike any other structure for learning, it is based on four pillars.
The 4 Pillars of Profit
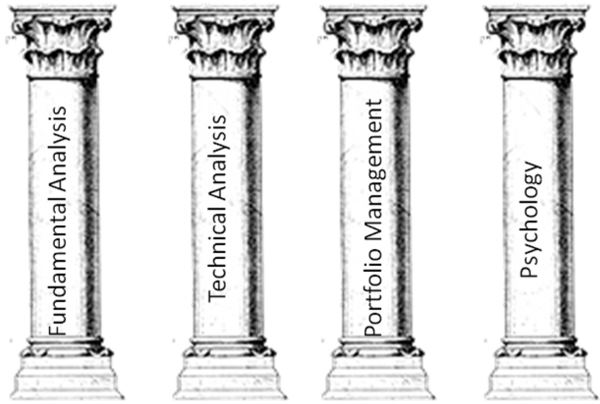
Each pillar represents a critical foundation of knowledge. A deep understanding of these pillars will enable you to excel in the Stock market. This knowledge will mean you no longer seek stock tips, yearn for advice, or be insecure in your trades. You will be a master.
Soon, we will look inside the pillars to find critical knowledge.
But first, you need to know there is a war between the stock market professionals.
The War: The Fundamentalists versus the Technicians
Perhaps the word war is a little strong, but it is a war of words.
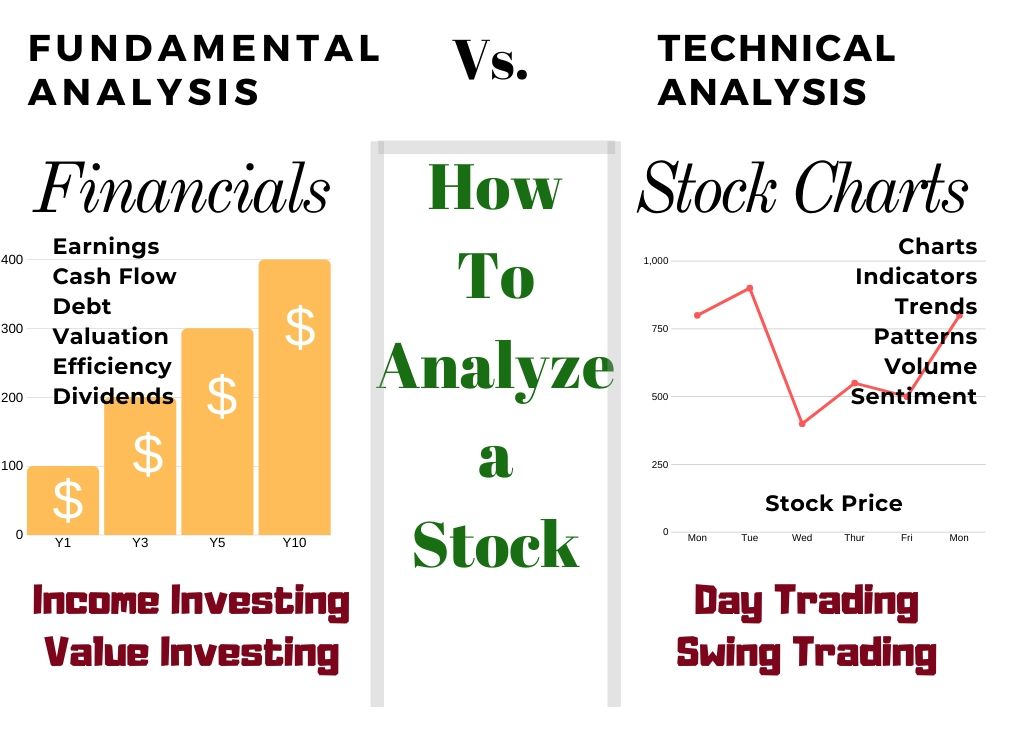
Fundamental Analysis
- Studies the why!
- Studies the cause!
- Focus on value
- Focus on economic data
- Focus on fundamentals
- Forms hypotheses based on fundamental data on what has value and, therefore, forecasts using news and economics or simply the value of a business.
Technical Analysis
- Studies the what!
- Studies the effect!
- Focus on market action.
- Focus on price.
- Focus on trends.
- Forms hypothesis based on what actually happens in the marketplace only forms an opinion about the market based on what the market or stock tells them. Supply and demand.
What does this mean: Fundamental Analysis and Technical Analysis?
Imagine, if you will, the job of a Meteorologist. One of the core tasks of meteorologists is to predict the weather. The approach to weather prediction is in many ways like traders and investors approach the market.
The fundamental approach to weather forecasting means you need to understand the fundamentals. Why do rain clouds form? What happens when cold air meets warmer air? How do thunder and lightning occur? How does hail or snow form? Why do winds move in particular directions in general? What types of rain clouds produce what types of weather?
However, understanding all the fundamentals does not enable you to predict the weather on a particular day for a particular region. This is similar to the market.
Understanding how the Federal Reserve works does not enable you to predict the stock price of ABC Inc., nor does knowing that ABC has increased its sales guarantee a stock price increase in any way.
Weather forecasters also use a technical approach to predict the weather. They measure the direction of the wind, the temperature of the air, the humidity, levels of rainfall, and cloud density.
Using this information, the weather forecaster can combine what is happening with their understanding of the fundamentals of weather to predict the weather in a particular area.
Of course, they are never 100% correct in their predictions as the weather, like the Stock Market, has so many chaotic influences that it is impossible always to be correct.
However, if you know that it is currently raining in New York City and the wind is blowing from the north at a certain speed, you can predict accurately when it will rain in New Jersey.
Using Technical analysis on the stock market is exactly the same. If you know that the market trend is up (the wind direction) and you can see the price movement of a stock is accelerating (wind speed), and you know how much power the rally is carrying using Volume and Momentum, and you can see where the next resistance area will be (New Jersey) then you can assess the probability of a stock price increase.
You can then use this probability to assess your risk-reward of being correct (forecast the weather) and then place the trade (announce the weather forecast on TV)
Understanding the conditions that breed a healthy stock market and a healthy company is fundamentally important.
However, if you buy any stock at the wrong time when supply and demand are not in your favor, you stand a strong chance of losing money. This is why the technical approach is so important.
Part 4 – The Fundamental Analysis Pillar
This section takes a look at the pillar of fundamental analysis. Fundamental investors or value investors like Warren Buffet or Benjamin Graham seek out investments where the trade risk is extremely low due to the large difference between the value of the stock and the underlying fundamentals.
Many other critical fundamental factors play a role in the stock market. The following image enables you to visualize how this fits together.

The effect of monetary and fiscal policy, in many ways, determines the stock market’s overall direction. They also directly impact employment and demand.
Learning about the fundamental impact of government economic policy and money supply on the market is crucial to your long-term success.
From this information, we can assess the long-term market direction. This will enable us, in turn, to adapt our strategy to the market.
Once you have established the market’s long-term direction, you can decide which companies you will seek to invest in. For example, if the market declines, you would seek to “go short” on the worst companies in the sector.
If the market is in a long-term uptrend, you will seek to “go long” on the best companies in the sector.
To learn more about fundamental analysis, evaluating the market direction, and finding great companies, I highly recommend the Liberated Stock Trader Pro Training.
Part 5 – The Technical Analysis Pillar
Welcome to part 5 in the “Stock Market Profits Blueprint series.” This section takes a look at the pillar of technical analysis. Technical Theory is the study of fundamentals, but indirectly.
A stock with great fundamentals can increase in value, but when?
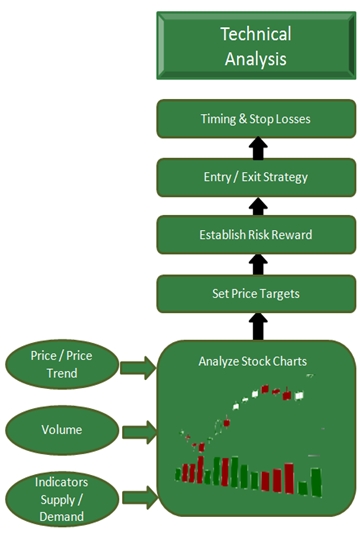
Technical analysis studies the effect of good fundamentals, not the cause. So, when it is time for a stock price to increase, the technical analyst will see this in the charts.
Whether the reason is good news, fundamentals, positive sentiment in the market, or improving the business climate, all will be seen by studying the price in the format of charts.
Contrary to popular belief, having a solid grasp of technical analysis enables you to combine it perfectly with your fundamental knowledge of markets and companies.
Stock chart analysis enables you to see the supply and demand balance, especially when used professionally with some excellent Price & Price Volume indicators available.
You can then set a price target based on chart patterns and use these price targets to establish your risk-reward ratios.
This, in turn, will enable you to plan exactly your entry and exit strategies for your stock. Technical analysis also allows you to optimize timing and stop losses to minimize risk and maximize your reward.
Part 6 – Fundamental & Technical Analysis Combined
Welcome to part 6 of the Stock Market Profits Blueprint.
The Tides and the Waves.
Think of the stock market like the ocean. The ocean has tides (the gravity-led movement of the ocean) and waves (caused by short-term winds and currents).
The Tides
Suppose you imagine that Fundamental Analysis enables you to analyze the movement of the tides. Those big long-term trends, either a bull or Bear Market, are largely dictated by economics.
- Is the economic situation favorable to long-term investments and business?
- Is monetary and fiscal policy loose and favorable? E.g., Easy, low-cost credit and growth investments from governments.
- Is employment and demand for goods and services buoyant? Meaning that revenues will continue to increase.
- Is the business cycle positive?
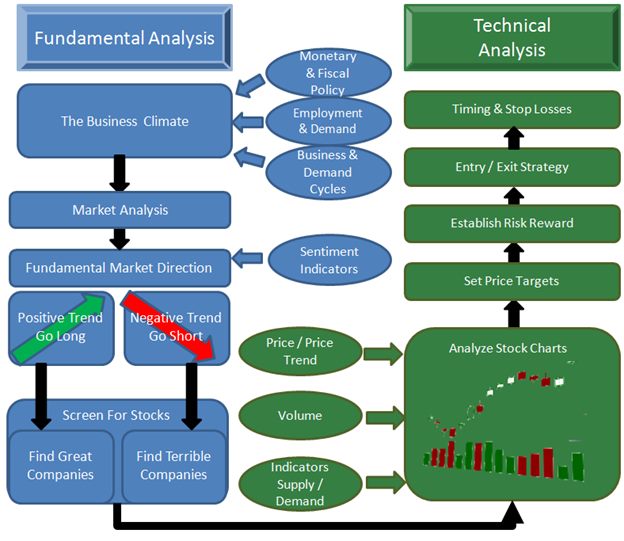
The Waves
Technical analysis is similar to the waves in the ocean.
The waves are the supply and demand in the marketplace. The waves are measured in price and trend. The volume of buyers and sellers dictates the size and frequency of the waves.
Take some time to understand the picture of the ocean from above. By understanding this, you can understand what indicators and measures to use when analyzing the overall market trend and the time to buy and sell your stocks.
Part 7- Portfolio Management
Welcome to Part 7 of the Stock Market Profits Blueprint series – Portfolio Management.
The importance of managing your stock portfolio & money management is often underestimated. This is an absolutely vital area of mastery if you are to succeed in the long term and generate consistent revenue from your investments.
The Portfolio Management pillar.
Portfolio management is managing your money optimally and understanding how to use compounding and solid growth to maximize your portfolio’s worth.
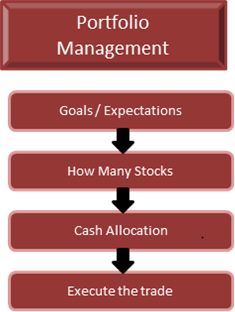
Setting solid expectations and real targets to achieve is key. See “How to Become a Stock Market Millionaire” in the Liberated Stock Trader PRO Training.
There are many questions that you need to answer for yourself before you begin investing or trading.
Those answers will be different for each individual, depending on your profile.
For example:
- How long will you be investing?
- How much money do you have to invest?
- Are you retired or still earning a regular income?
- What is your tolerance for risk?
Know Thyself
Key Questions to ask yourself:
- Do I favor Diversification or concentration?
- How many stocks should I buy?
- How long should I hold stocks?
- How much should I reserve in cash?
- How much should I invest in any one stock?
- How can you optimally execute the trade?
- What risk-reward factors should I use?
- How do I secure against significant losses?
- When should we exit a trade?
- What size of a win do I need, and how many?
These questions are key and discussed in the Liberated Stock Trader PRO Training.
Part 8- The Psychology of You
What most people neglect to work on are the psychological aspects of trading. This is why I do not believe using stock market simulation games provides a realistic indication of future performance.
It is a completely different sport when real money is on the line.
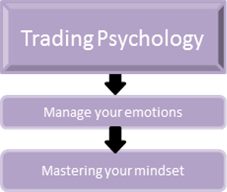
You will watch each tick up and down of the market. You will constantly doubt whether you did the right thing in the trade or your analysis. When the trade goes against you, you will feel negative emotions: should I sell, hold, and wait for a bounce-back, or buy more to average down?
Mastering your mindset is important and can greatly assist you while “in trade.”
Learn to manage your emotions practically. There are many practical and personal lessons we can get from other traders.
Being the Ruler of You.
Set up and review your “in-trade rules” to be as emotion-free as possible.
For example. If you thoroughly establish ground rules for your trades before you make them, then if you stick to them, this should help remove some of the emotion inherent in trading your own money.
Trade Rules take the shape of:
- What criteria should be met before I purchase the stock?
- How much will I invest?
- When the stock price drops to this level, what will I do?
- When the stock price rises to this level, what will I do?
- I will exit the trade when the criteria are met.
This is a notoriously difficult area of trading to improve. Who can honestly say they are in complete control of their emotions? Not me, for sure.
Recommended Reading: Market Wizards: Jack D. Schwager; The New Market Wizards: Jack D. Schwager; Stock Market Wizards: Jack D. Schwager
Part 9 – The Complete Stock Market Strategy Blueprint
Welcome to the final part of the Stock Market Profits Blueprint Series. The system is essentially a roadmap to follow to enable you to chart a course through the many stages required to make rational, intelligent investment decisions.
Here, you can now see the complete picture. Fundamental and Technical Analysis have factors that influence them, leading to portfolio management and psychology elements.
Follow the black arrows from the top left to the bottom right.

Download the Stock Market Blueprint eBook

Download the Full 22 Page LiberatedStockTrader-Stock-Market-Strategy-Blueprint-ebook
The Right Education for the Stock Market Profits Blueprint
You want to be a successful stock investor but don't know where to start.
Learning stock market investing on your own can be overwhelming. There's so much information out there, and it's hard to know what's true and what's not.

Liberated Stock Trader Pro Investing Course
Our pro investing classes are the perfect way to learn stock investing. You will learn everything you need to know about financial analysis, charts, stock screening, and portfolio building so you can start building wealth today.
★ 16 Hours of Video Lessons + eBook ★
★ Complete Financial Analysis Lessons ★
★ 6 Proven Investing Strategies ★
★ Professional Grade Stock Chart Analysis Classes ★
About the Author: Barry D. Moore is a Certified Financial Technical Analyst (STA/IFTA) Accredited Technician with 20 years of investing experience and a published author.