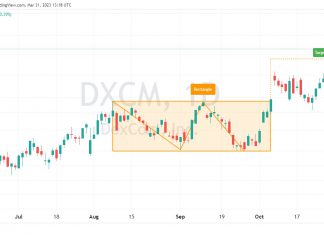
How to Trade a Rectangle Pattern’s 85% Success Rate
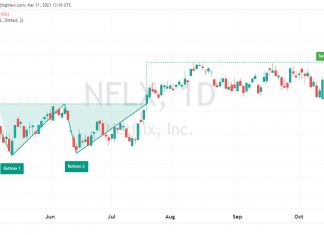
A rectangle is a well-established technical analysis pattern with a predictive accuracy of 85%. The pattern is flexible, can break out up or down, and is a continuation or reversal pattern.
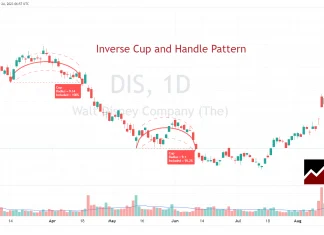
Inverse Cup and Handle: 82% Reliability for Short-Sellers
The inverse cup and handle chart pattern is a technical analysis trading strategy. Traders use it to identify a breakdown in asset prices, aiming to profit from short-selling a sharp price decline. The inverse cup and handle chart pattern is considered reliable based on 556+ trades, with an 82% success rate in bull markets.
8 Bearish Chart Patterns Proven Accurate & Reliable
Decades of research prove the most profitable bearish chart patterns are the Inverted Cup and Handle with an average -17% price decrease, Rectangle Top (-16%), Head and Shoulders (-16%), and the Descending Triangle (-15%).
Bear Flag Pattern: Reliability & Success Rate Based On Data
Be careful when trading bearish flags. According to published research, the bear flag pattern has a low success rate of 45%. This means you are flipping a coin when trading this pattern, as the odds are not in your favor. The high-tight bear flag is the only flag pattern you should trade.
10 Bullish Chart Patterns Proven Effective & Profitable
Research shows the most reliable and accurate bullish patterns are the Cup and Handle, with a 95% bullish success rate, Head & Shoulders (89%), Double Bottom (88%), and Triple Bottom (87%). The most profitable chart pattern is the Bullish Rectangle Top, with a 51% average profit.
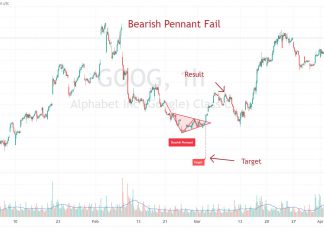
Bear Pennant: Why Traders Must Avoid this Pattern
Traders should avoid trading bear pennants. Decades of testing on over 1,600 trades show bearish pennants have a success rate of only 54% and a low price decrease of 6%. The evidence is clear, pattern trading bear pennants is not worthwhile.
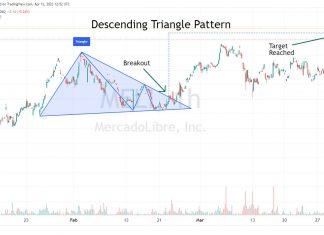
Trading a Descending Triangle’s 87% Success Rate
Twenty years of trading research show the descending triangle pattern has an 87% success rate in bull markets and an average profit potential of +38%. The descending triangle pattern is popular because it is reliable, accurate, and generates a good average profit.
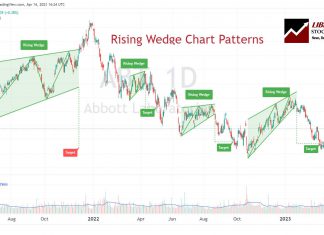
Trading the Rising Wedge Pattern’s 81% Success Rate
According to multi-year testing, the rising wedge pattern has a solid 81% success rate in bull markets with an average potential profit of +38%. The ascending wedge is a reliable, accurate pattern, and if used correctly, gives you an edge in trading.
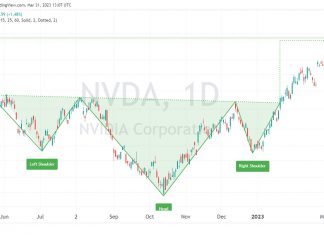
Trade the Inverse Head & Shoulders with 89% Accuracy
The inverse head and shoulders pattern is one of the most accurate technical analysis reversal patterns, with a reliability of 89%. It occurs when the price hits new lows on three separate occasions, with two lows forming the shoulders and the central trough forming the head.
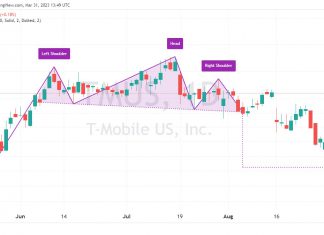
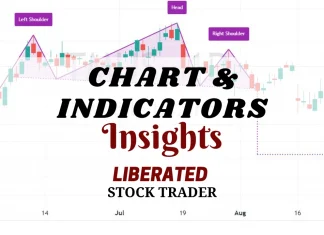
Head & Shoulders Pattern: Trade an 81% Success Rate
The head and shoulders pattern is one of the most accurate technical analysis reversal patterns, with a reliability of 81%. A head and shoulders top occurs when the price peaks on three separate occasions, with two peaks forming the "shoulders" and the central peak forming the head.
Trading a Double Bottom Pattern’s 88% Success Rate
Decades of research reveal the double bottom pattern has an 88% success rate in bull markets and an average profit potential of +50%. The double-bottom chart pattern is one of the most reliable and accurate chart indicators for traders.
Reading & Trading Volume Profile Indicators Like a Pro
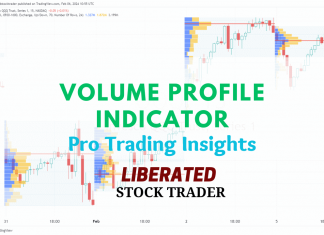
Volume profile technical analysis indicators provide a uniquely detailed overview of volume distribution across price levels, offering traders insights into market structure and supply and demand zones.
Bull Pennant: Why Traders Lose With This Pattern
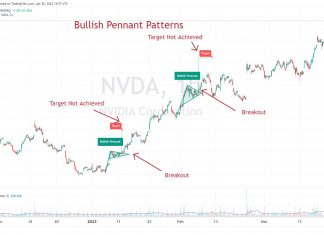
Traders must be cautious when trading bull pennants. Published research reveals a low success rate of 54% and a meager price increase of 7%. This implies pattern trading bullish pennants is as good as coin-flipping with unfavorable odds.
5 Steps to Choose the Best Technical Analysis Course
When selecting a technical analysis course, consider your preference for industry certification, certified instructors, or both. Also, think about the course duration and depth of content that best suits your needs. Lastly, check the training provider's returns policy for peace of mind.
Falling Wedge Pattern: A 74% Chance of a 38% Profit!
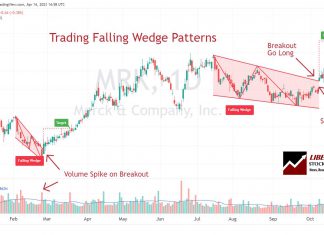
A falling wedge is a technical analysis pattern with a predictive accuracy of 74%. The pattern can break out up or down but is primarily considered bullish, rising 68% of the time.
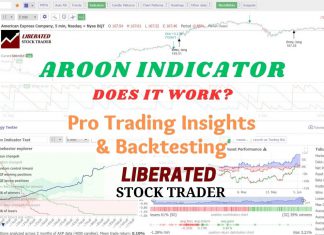
Aroon Indicator Explained: Best Settings & Strategy Tested
In technical analysis, the Aroon indicator identifies trend reversals and trend strength. This oscillating indicator has two parts: the "Aroon Up" line measures uptrend strength, and the "Aroon Down" line for downtrend strength.
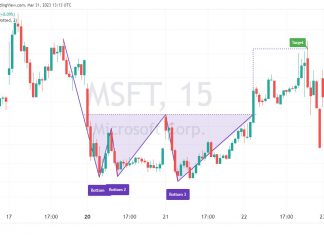
Triple Bottom Pattern: Trading an 87% Success Rate
Decades of trading research show the triple-bottom pattern has an 87% success rate in bull markets and an average profit potential of +45%. The triple bottom chart pattern is popular because it is reliable and accurate and generates a good average profit for traders.
Stock Market Trends: 6 Steps for Better Trend Analysis
All stock market trends can be described by using the following definitions. Market timeframes are short-term-medium-term, and long-term. Market direction is described using uptrend, downtrend, or consolidation.
How to Draw Trendlines on Stock Charts Like a Boss
Drawing trendlines on stock charts is a powerful way to assess the direction of the market. Trendlines help you understand the trend direction and timeframe to set expectations for future market moves.
Stock Order Types: Using Market, Limit & Trailing Stops in Trading
Limit, market, and stop limit orders, help ensure you get the best possible stock purchase price. Stop limit, stop market, and trailing stop orders help sell your stocks for profit or limit your risk.
Our Best Training & Strategies
Liberated Stock Trader Pro: Learn Stock Market Investing
Learn stock market investing with the complete online stock trading course by Barry D. Moore, a certified financial analyst from the International Federation of Technical Analysts (IFTA).
ETF Investing Strategy: MOSES Improves Performance & Lowers Risk
The MOSES ETF investing strategy is a powerful suite of indicators meticulously backtested over 100 years. Designed to empower you to outperform the market, it equips you with the tools to navigate major stock market crashes and unlock greater investing performance.
Our LST Strategy Beat the Stock Market’s S&P 500 By 102%...
Decades of research and testing unveiled the Liberated Stock Trader Beat the Market System. Our 9-year, backtested, and proven strategy targets 35 financially healthy high-growth stocks, producing a track record of beating the S&P 500 by 102%.
TradingView Review 2024: Tested by LiberatedStockTrader
Our testing shows TradingView is best for international stock, Fx, and Crypto traders. It's the ultimate all-rounder with a global community, heatmaps, broker integration, pattern recognition, backtesting, and screening.
Stock Rover Review 2024: Is It The Best Stock Screener?
Our testing shows Stock Rover is best for long-term dividend, value, and growth investors. Its exceptional features are in-depth screening of a 10-year financial database, research reports, and broker-integrated portfolio management.
Trade Ideas Review 2024: Holly AI Bot Tested by LiberatedStockTrader
Our in-depth testing shows Trade Ideas is the ultimate black box AI-powered day trading signal platform with built-in automated bot trading. Three automated Holly AI systems pinpoint trading signals for day traders.
TrendSpider Review: Big 2024 Updates! Is It Now The Best?
Our TrendSpider testing finds it is ideal for US traders wanting AI-automated charting, pattern recognition, and backtesting of stocks, indices, futures, and currencies.
Benzinga Pro Review 2024: Tested by LiberatedStockTrader
Our testing shows Benzinga Pro is best for US traders who want a high-speed, actionable, real-time news feed at 1/10th of the price of a Bloomberg terminal. I recommended Benzinga Pro for active day traders and investors who trade news events.
MetaStock Review 2024: Tested by LiberatedStockTrader
Our MetaStock review and test reveal an excellent platform for traders, with 300+ charts and indicators for stocks, ETFs, bonds & forex globally. Metastock has solid backtesting and forecasting, and Refinitiv/Xenith provides powerful real-time news and screening.

