Barry D. Moore CFTe
406 POSTS
239 COMMENTS
With a wealth of experience spanning 25 years in stock investing and trading, Barry D. Moore (CFTe) is an author and Certified Financial Technician (Market Analyst) recognized by the International Federation of Technical Analysts (IFTA). Notably, he has also held executive positions in leading Silicon Valley corporations IBM Corp. and Hewlett Packard Inc.
Mean Reversion Trading Strategy Explained with Examples
The mean reversion trading strategy suggests prices and returns eventually move back toward the mean or average. Reliable indicators like Stochastics, RSI, and Bollinger bands are based on mean reversion to identify overbought and oversold conditions.
Aroon Indicator Explained: Best Settings & Strategy Tested
In technical analysis, the Aroon indicator identifies trend reversals and trend strength. This oscillating indicator has two parts: the "Aroon Up" line measures uptrend strength, and the "Aroon Down" line for downtrend strength.
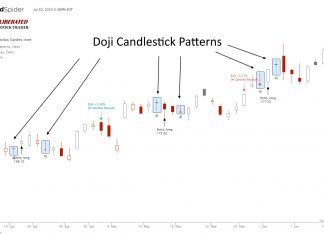
Trading a Doji Candle Explained: I Backtest It For Reliability!
A Doji candlestick chart pattern indicates a battle between buyers and sellers, ending in equilibrium. The Doji marks a potential trend reversal. Is the Doji pattern profitable or accurate? Our evidence suggests its profitability is marginal.
Reading & Trading Volume Profile Indicators Like a Pro
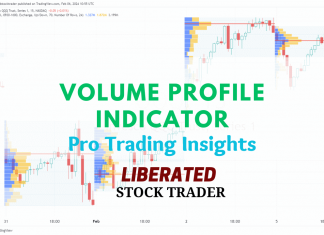
Volume profile technical analysis indicators provide a uniquely detailed overview of volume distribution across price levels, offering traders insights into market structure and supply and demand zones.
Sell In May And Go Away! Is It True? Debunking the...
Our 60 years of research shows that the stock market maxim "Sell in May and go away" is misleading and detrimental to your investing performance. The 60-year average return of June, July, and August outweigh any losses incurred during bad years.
Riot Games Stock: Investing In 3 Top Games Companies
You cannot buy stock in Riot Games directly because Riot Games is not a publicly listed company. You can buy stock in the company that owns Riot Games, Tencent Holdings ADR (OTCMKTS: TCHEY), as Riot Games is a subsidiary of Tencent Holdings.
Bearish Harami Pattern: 5,624 Trades Tested for Reliability!
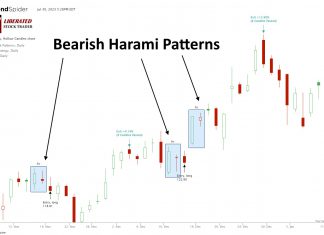
Our research shows Bearish Harami and Bearish Harami Cross are profitable patterns. Based on 1,136 years of data, the Bullish Harami has an average profit per trade of 0.48% and the Harami Cross 0.57%.
Gravestone Doji Explained & Reliability Tested!
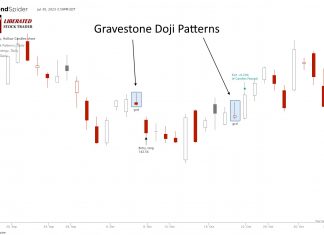
A Gravestone Doji candle indicates a battle between buyers and sellers and is considered bearish. Our 1,553 test trades prove it is the third most profitable candle pattern. But it does not work as most traders believe.
How to Read Candlestick Charts Using 5 Reliable Patterns
You can read candlestick charts using pattern recognition software to identify five reliable patterns, the Inverted Hammer, Bearish Marubozu, Gravestone Doji, Bearish Engulfing, and Bullish Harami Cross.
How to Trade the DMI Indicator Profitably: 9,764 Trades Tested
Our testing, based on 9,764 trades over 25 years, proves the DMI indicator is profitable and reliable, outperforming the S&P 500 index.
Listen To Our Stock Market Investing & Trading Podcasts
Welcome to Liberated Stock Trader, the ultimate resource for learning how to invest in the stock market. Our goal is to provide you with...
13 True Finance Documentaries That Will Change Your World
Our curated list of the 13 best finance movies selects Inside Job, The Big Short, Too Big to Fail, The Spider's Web, and Chasing Madoff as the most entertaining true story documentaries.
26 Best Stock Market Books of All Time [2024 Edition]
The best stock market books of all time are The Little Book that Still Beats the Market, A Man for All Markets, How to Make Money in Stocks, Dark Pools, Technical Analysis of the Financial Markets, and The Intelligent Investor.
20 Great Books To Kick-Start Your Investing in 2024
Starting Your Investing Journey? We Share 22 Highly Rated Investing Books for Beginners Investing In Stocks, Property, ETFs, Bonds & Mutual Funds
Simple Moving Average Trading Settings & Strategy Tested
The simple moving average (SMA) technical analysis indicator helps identify stock price trends. It calculates an arithmetic average of prices, offering a smooth line that eliminates short-term price volatility.
ATR Indicator: Settings, Reliability & Usage Tested
The average true range (ATR) is a nondirectional momentum indicator that measures price volatility. Our 1,205 test trades showed a solid 1.77 reward-to-risk ratio with an average 8.5% winning trade.
Fibonacci Retracement Trading Tested! Does it Work?
In technical analysis, Fibonacci retracement is used by traders to predict levels of support and resistance by drawing horizontal lines according to the Fibonacci sequence. But Does It Work?
VWAP Indicator Best Settings & Strategy Based on 13,681 Trades
Using VWAP with a 14 setting on a daily Heikin Ashi chart is vastly superior to conventional OHLC charts. Using an OHLC chart, the strategy barely breaks even with a low-profit expectancy of 0.15. In contrast with a Heikin Ashi chart, the strategy is incredibly profitable, with a profit expectance of 0.83 and a reward-to-risk ratio of 3.03.
Is the Supertrend Indicator Super? 4,052 Test Trades Show How to...
Based on our extensive testing, it has been determined that when used as a standalone indicator, Supertrend does not demonstrate reliability or profitability. With an average profit expectancy of 0.24, it is recommended to combine Supertrend with other indicators.
Ordinary vs. Qualified Dividends Less Tax & More Profit
Ordinary dividends are taxed at the individual investor's marginal rate, while qualified dividends are subject to a lower tax rate. Qualified dividends must also meet certain criteria like holding period and stock ownership.













![26 Best Stock Market Books of All Time [2024 Edition] Best Stock Market Books](https://www.liberatedstocktrader.com/wp-content/uploads/2022/10/best-stock-market-books-ever-e1666869453656-324x235.jpg)
