MACD is a trend-following momentum indicator used to identify price trends. We conducted 606,422 test trades to find the best settings and trading strategies.
The MACD indicator is popular and widely used by traders, but our testing shows poor performance. Our data backtesting shows a low reliability of 26% on a day trading 5-minute chart and a 3% success rate on a daily chart.
☆ Research You Can Trust ☆
My analysis, research and testing stems from 25 years of trading experience and my Financial Technician Certification with the International Federation of Technical Analysts.
Using the power of TrendSpider’s backtesting engine, we can scientifically test the accuracy and success rate of the MACD indicator and the optimal settings.
Many chart indicators are unprofitable, and MACD is included in this category. Learn everything you need to know about trading the MACD indicator.
What Is the MACD Indicator?
The Moving Average Convergence Divergence (MACD) is a widely used yet poorly performing technical analysis indicator. Traders are misled into believing they can profit from this indicator.
MACD is a trend-following momentum indicator that theoretically helps traders identify price trends and potential trading opportunities. MACD is visually appealing, displaying a histogram that acts like a heartbeat for the stock. Unfortunately, MACD’s visual appeal is not backed up by its success rate.
What Does MACD Mean?
MACD stands for Moving Average Convergence Divergence. Developed in 1979 by Gerald Appel, the MACD indicator measures the difference between two exponential moving averages (EMAs) of closing prices. The convergence and divergence of the two moving averages are measured. The further apart the lines are, the greater the momentum or strength of the trend. When the moving averages cross over one another, it signals a potential change in price direction.
The MACD also includes a signal line to generate buy and sell signals.
KEY TAKEAWAYS
- MACD is a poor-performing chart indicator.
- MACD produces many small losses when prices consolidate.
- While visually appealing, MACD is not a good indicator for day traders or investors.
- MACD produces many false signals.
- Testing shows MACD is better on Heikin Ashi charts.
Understanding MACD
The MACD uses three moving averages to create a trading signal – the faster 12-period EMA, the slower 26-period EMA, and a 9-period EMA that signals the direction of the MACD line.
The main purpose of MACD is to identify new trends and spot divergences between prices and the indicator. It can provide a trader with an indication of whether a trend is likely to continue or reverse. When combined with other indicators and signals, MACD can form the basis of a trading strategy.
Traders often try to employ this indicator to identify potential entry and exit points in a market.
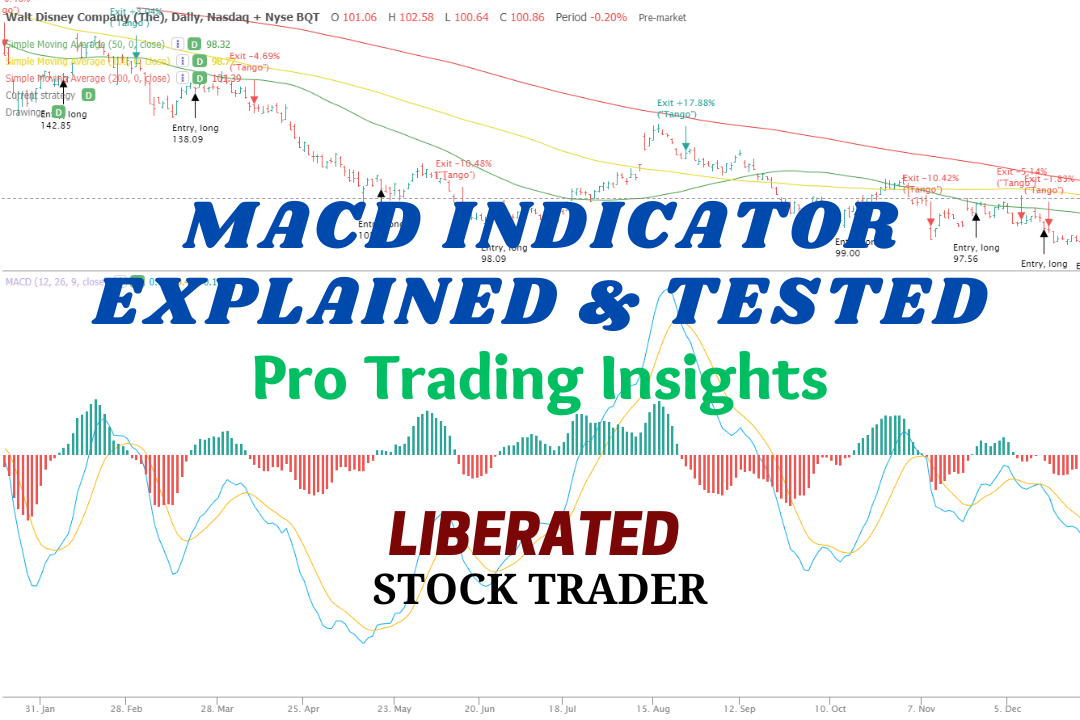
MACD Chart Example
A nine-day EMA of the MACD, known as the “signal line,” is plotted on top of the MACD line, which can be used as a trigger for buy and sell signals. When the MACD crosses above the signal line, it is seen as a bullish sign that could indicate a potential buying opportunity. Conversely, when the MACD crosses below the signal line, it is seen as a bearish sign that could indicate a potential selling opportunity. (See chart below)
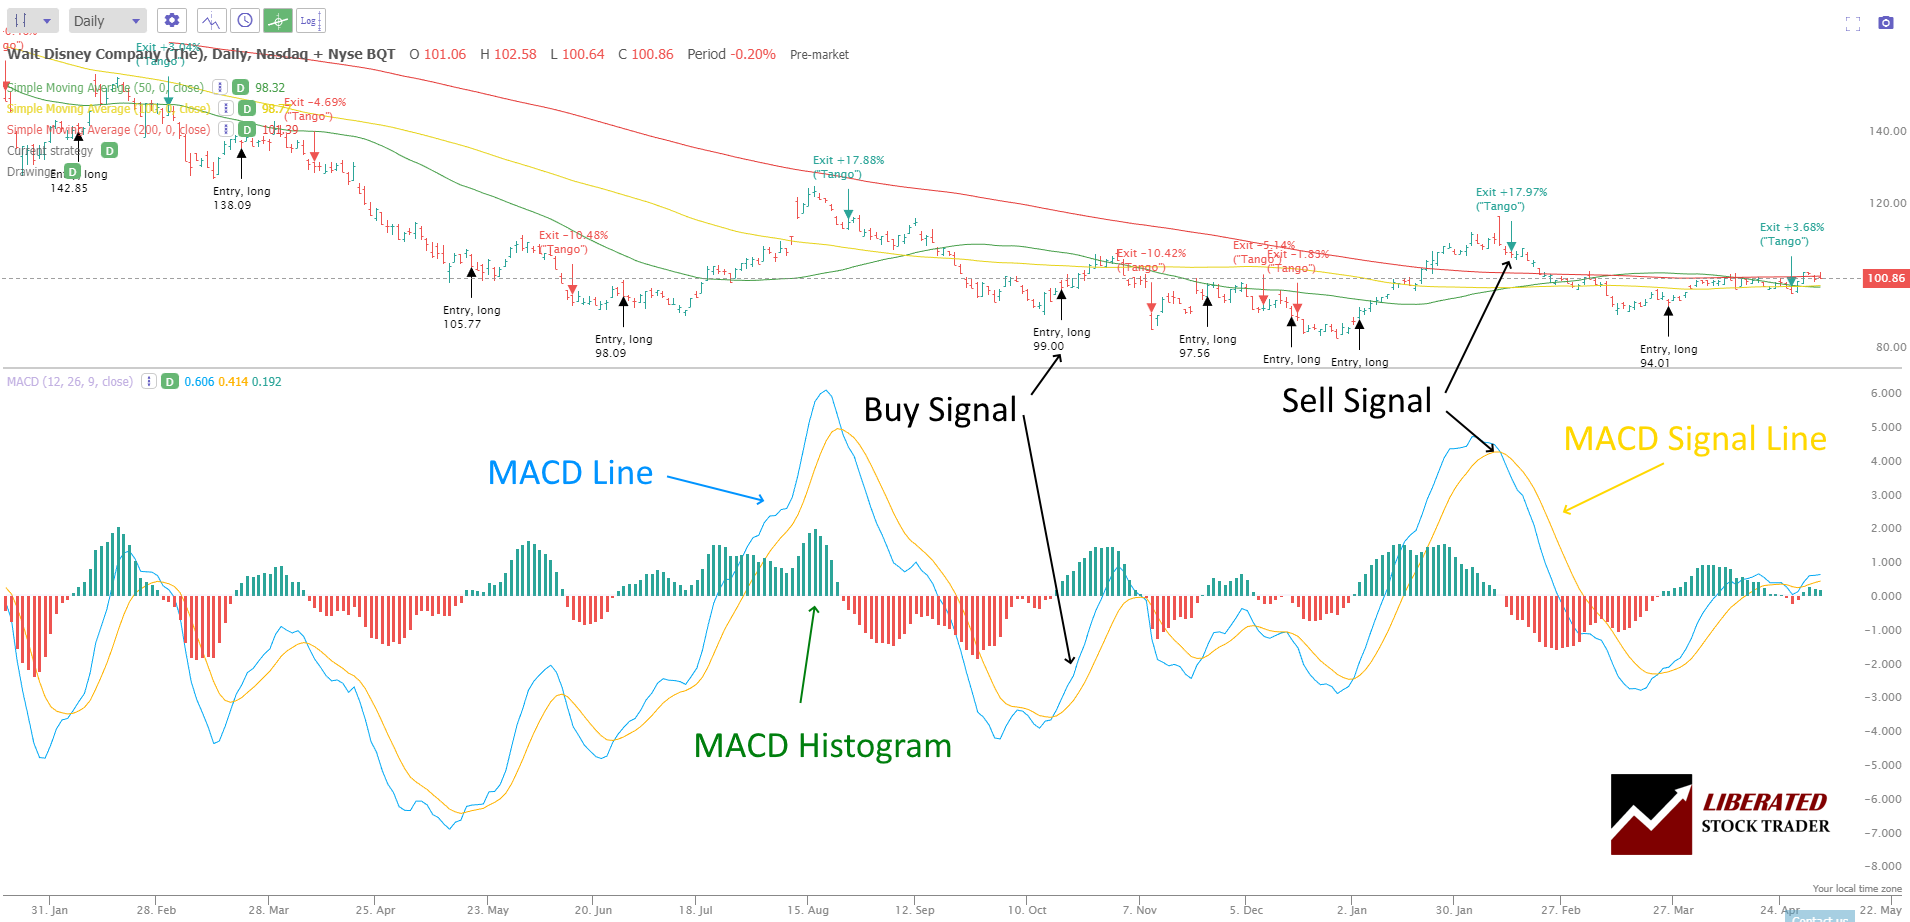
MACD Histogram
The MACD Histogram is another useful indicator derived from the MACD Line. It subtracts the signal line from the MACD Line and is an effective tool for identifying momentum and divergences in price movements.
When the MACD Line rises faster than its signal line, the histogram bars tend to grow in height. This suggests bullish momentum is increasing and could be used as a buy signal. On the contrary, when the MACD Line falls faster than its signal line, the histogram bars will move below zero, a bearish signal indicating potential selling opportunities.
The histogram can also identify divergences between price and MACD Line movements. When prices increase while the MACD Line decreases simultaneously, it is known as a bearish divergence and is seen as a bearish sign that could indicate a potential sell signal.
MACD is an Oscillating Indicator
Yes, the MACD is an oscillating indicator. This means it will fluctuate between positive and negative values as the trend progresses. As mentioned earlier, bullish trends are generally associated with positive MACD values, while bearish trends tend to be accompanied by negative MACD values.
MACD is a Lagging Indicator
The MACD is a lagging indicator. This means it does not predict future price movements but follows them afterward. It is used to help traders identify trends that have already started and confirm when those trends are over.
What is the Formula for MACD?
The MACD formula is calculated as follows:
MACD Line = 12-period EMA – 26-period EMA
Signal Line = 9-period EMA of the MACD Line
Histogram = MACD Line – Signal Line
It is essential to note that the values for each moving average are adjusted over time, so the MACD line will continuously change.
How is MACD Calculated?
First, subtract the 26-period EMA from the 12-period EMA. Then, plot a 9-period moving average of that difference to create the signal line. Finally, subtract the Signal Line from the MACD Line to generate the histogram. The result is then plotted over a zero line overlaid on the signal line.
The standard signal line is a 9-period EMA of the MACD line and can provide additional insight into momentum and trend reversals. When the MACD crosses above the signal line, it indicates that buyers are outnumbering sellers and could be seen as a sign that the underlying asset is increasing in momentum. Conversely, when the MACD crosses below the signal line, it indicates that sellers outnumber buyers and could be seen as a sign of downward momentum.
MACD Divergences
The MACD indicator can also identify divergences between price action and the MACD line, providing additional insight into trend reversals. When the price action is making higher highs, but the MACD line or histogram fails to do so, it could be a sign of bearish divergence and a potential shift in momentum from bullish to bearish. Similarly, when the price action is making lower lows, but the MACD line fails to follow suit, it could indicate a bullish divergence and a potential shift in momentum from bearish to bullish.
How to Read the MACD Indicator?
To read a MACD chart, look for the point at which the MACD line crosses above or below the signal line. This point of intersection indicates a buy or sell signal, respectively. Additionally, when the MACD histogram is above zero, it may indicate an uptrend, while below zero could indicate a downtrend. Furthermore, identifying divergences between the MACD and price action could strongly indicate an upcoming change in momentum.
Pros:
- MACD is Visually Appealing.
- MACD is a very responsive indicator.
- MACD has many settings that can be optimized.
Cons:
- The MACD has a poor performance record, according to testing.
- MACD generates a low reward-to-risk ratio of 1.7.
- MACD is not suitable for trading stable assets with low price volatility.
- Testing shows the MACD has a low 2% spread between average win and loss.
How to use MACD in Trading?
I would not recommend using MACD in trading. I tested many variables to develop a trading strategy for MACD, but they all suffered the same problem inherent with moving averages. In periods of price consolidation, MACD produces false signals and generates many small losses.
Is the MACD Indicator Accurate?
No, the MACD indicator is inaccurate; it causes many small losses and misses good entry points. Backtesting the MACD indicator on 30 Dow Jones Industrial Average stocks over 20 years resulted in a 26% win rate, meaning it underperformed a buy-and-hold strategy 76% of the time.
MACD Indicator Backtesting Methodology
To backtest the MACD indicator, I used TrendSpider, the leading AI stock trading software with pattern recognition and a codeless backtesting engine. Testing was configured using OHLC and Heikin Ashi daily charts, and the exit criteria were set to the next trading day, HL2 (Price High + Low /2).
| MACD Test Criteria | Daily Settings | 5-Minute Settings |
| Index: | DJIA | DJIA |
| Date Range | 20 Years/5000 Candles | 3 Months/5000 Candles |
| Settings: | 12,26,9 | 12,26,9 |
| Entry Criteria: | MACD Histogram > 0, MACD > 0, MACD > Signal | MACD Histogram > 0, MACD > 0, MACD > Signal |
| Exit Criteria: | MACD Signal > MACD | MACD Signal > MACD |
| Sell: Next Open | (Price High + Low /2) | (Price High + Low /2) |
I test all indicators, including the MACD, using their standard recommended settings, different timeframes, and different chart types; this provides an unbiased result. Also, the entry and exit prices use an average of the high and low prices for the day, making the testing more realistic.
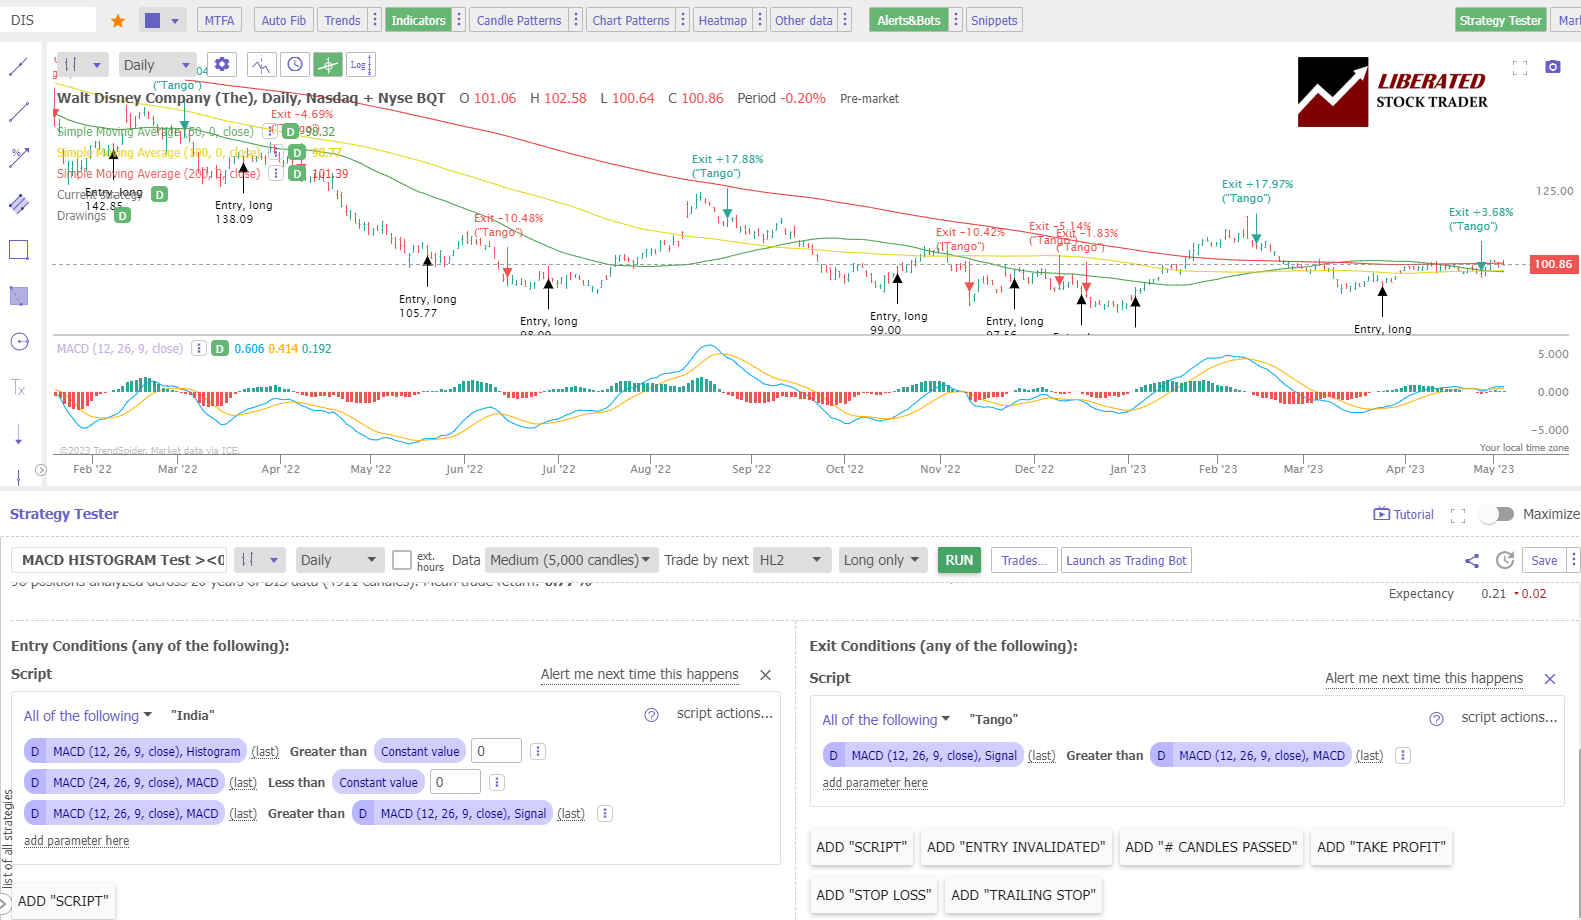
How to Set Up MACD Backtesting in TrendSpider
To set up backtesting, I used TrendSpider, our recommended trading software for serious traders. The screenshot below shows the exact configuration for our MACD backtesting.
My MACD testing for day trading was done using a standard OHLC candle chart and a Heikin Ashi chart.
MACD Backtesting Results for Day Trading
As you can see, while the day trading margins were tight, the Heiken Ash chart was a better setting for day trading than the OHLC candles. MACD beat buy and hold on 15 of the DJ30 stocks, giving a ratio of 50%, versus the OHLC trade, which had only a 26% success rate.
Only 40% of MACD trades were profitable, and the spread between winning and losing trades was 0.2%. This means MACD is an incredibly poor indicator for day traders.
| MACD 3-Month Backtest | OHLC Chart | Heikin Ashi Chart |
| Timeframe: | 5-min | 5-min |
| Average Reward/Risk Ratio: | 1.6 | 1.7 |
| % of Tickers Beating Buy & Hold | 26% | 50% |
| Average # Trades | 103 | 92 |
| Winning Trades %: | 40% | 44% |
| Average Win: | 0.42% | 0.64% |
| Average Loss: | -0.21% | -0.35% |
I tried many backtesting solutions, but this testing was only possible using TrendSpider.
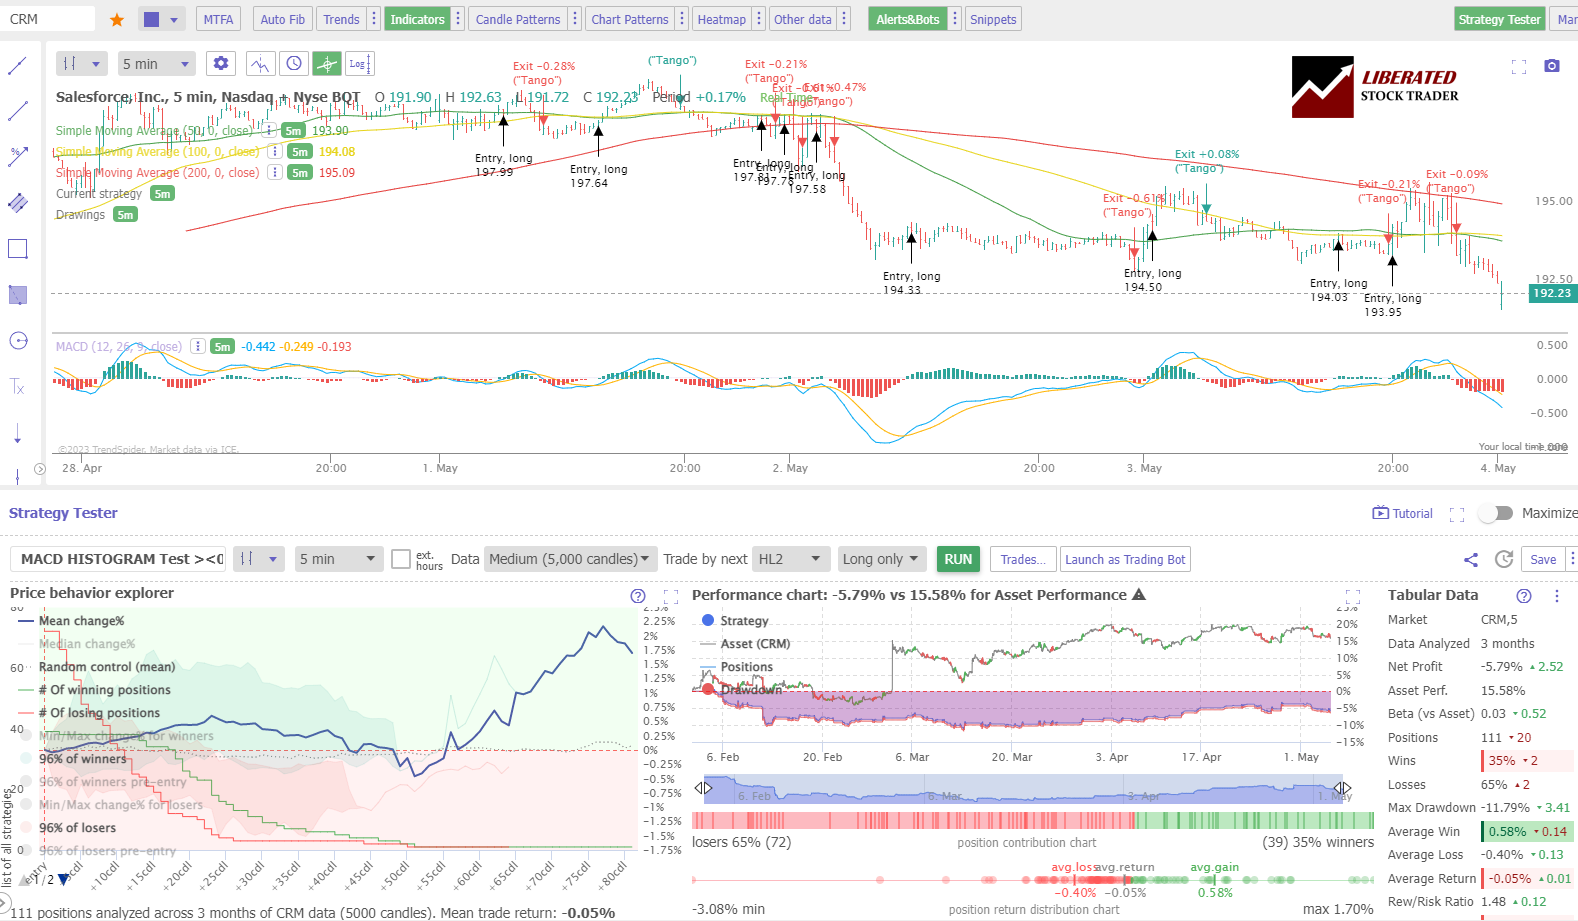
Testing MACD on OHLC Charts Example
In this typical example of MACD on an OHLC chart, day trading a 5-minute bar on Salesforce Inc. (Ticker: CRM) produced significant losses over three months. The trader would have lost 5.79%, while a buy-and-hold investor would make a profit of 15.58%. This makes MACD a poor choice for day trading on a candlestick chart.
Testing MACD on Heikin Ashi Charts Example
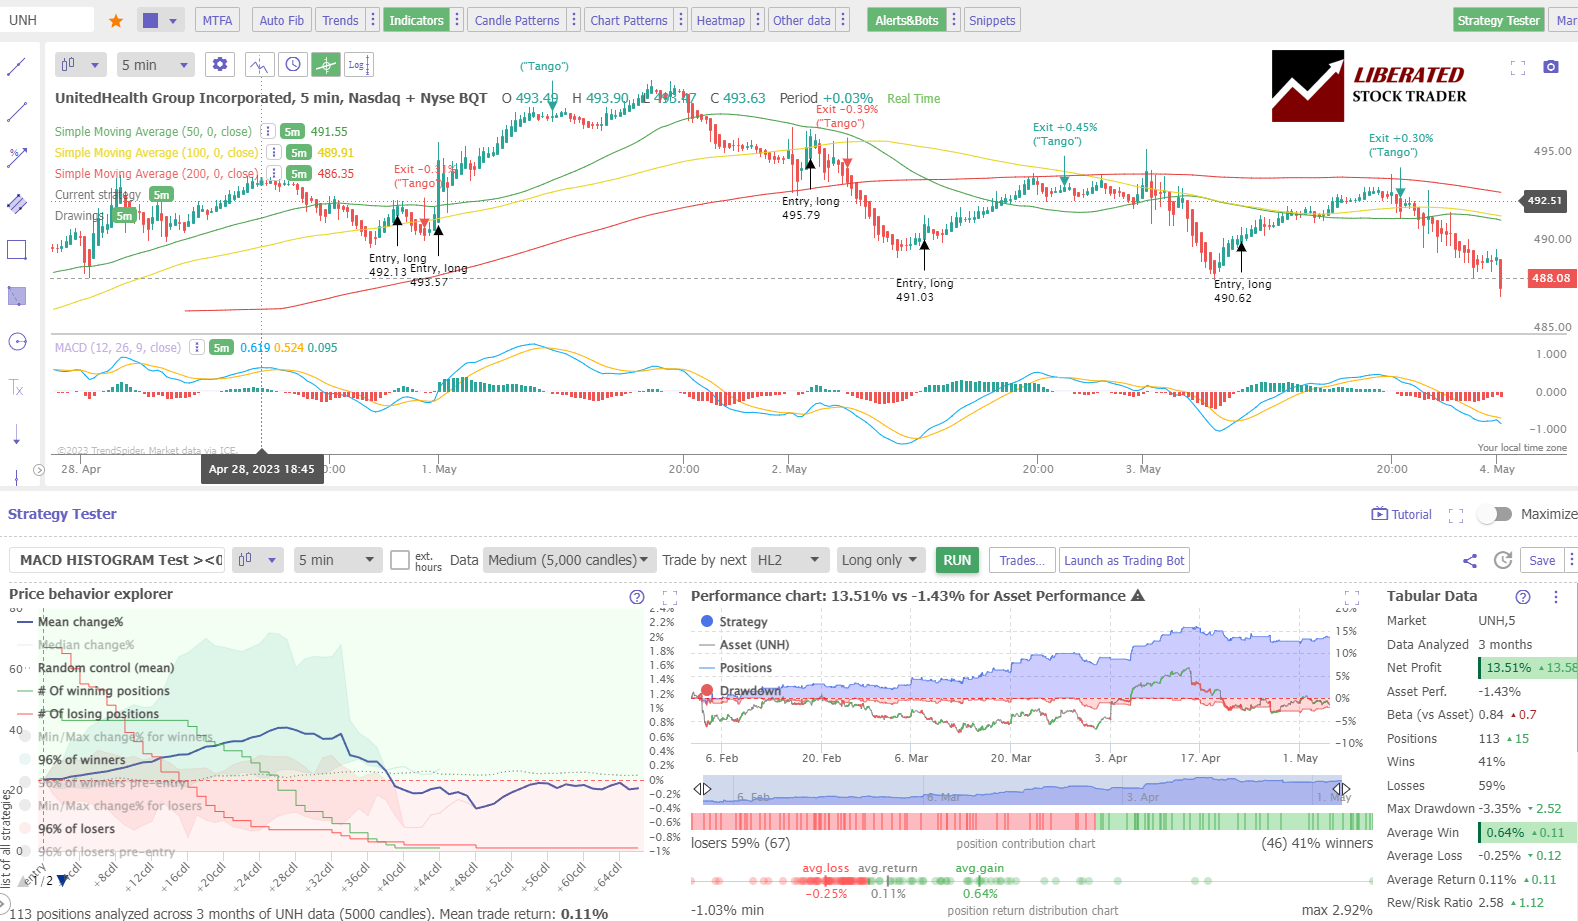
Testing MACD on a 5-minute Heikin Ashi chart on United Health (Ticker: UNH) produced a 13.51% win over three months. A buy-and-hold investor would have lost 1.43%. The smoothing effect of the Heikin Ashi chart means fewer false signals, resulting in 113 trades. This is a rare example of MACD making a significant profit. Many stocks go through periods of price consolidation, and this is what makes MACD ineffective.
Powerful Point & Click Backtesting With TrendSpider
Testing the MACD on Daily Charts
Testing the standard MACD settings on a daily candlestick/OHLC chart proves this indicator is poor, with 29 (97%) of the 30 DJIA stocks failing to beat a buy-and-hold strategy. Using a Heikin Ashi chart, the results were still weak, with MACD beating a buy-and-hold strategy only 26% of the time.
The table below shows that the spread between trading wins and losses is only 3%; combining this with a 40% trading win rate shows this indicator should be avoided.
MACD Backtesting Results for Daily Charts
| MACD 20-Year Backtest | OHLC Chart | Heikin Ashi Chart |
| Timeframe: | Daily | Daily |
| Average Reward/Risk Ratio: | 1.87 | 1.91 |
| % of Tickers Beating Buy & Hold | 3% | 26% |
| Average # Trades | 101 | 70 |
| Winning Trades %: | 40% | 42% |
| Average Win: | 7.6% | 6.2% |
| Average Loss: | -3.6% | 3.2% |
I tried many backtesting solutions, but this testing was only possible using TrendSpider.
Testing MACD on a Daily Chart Example.
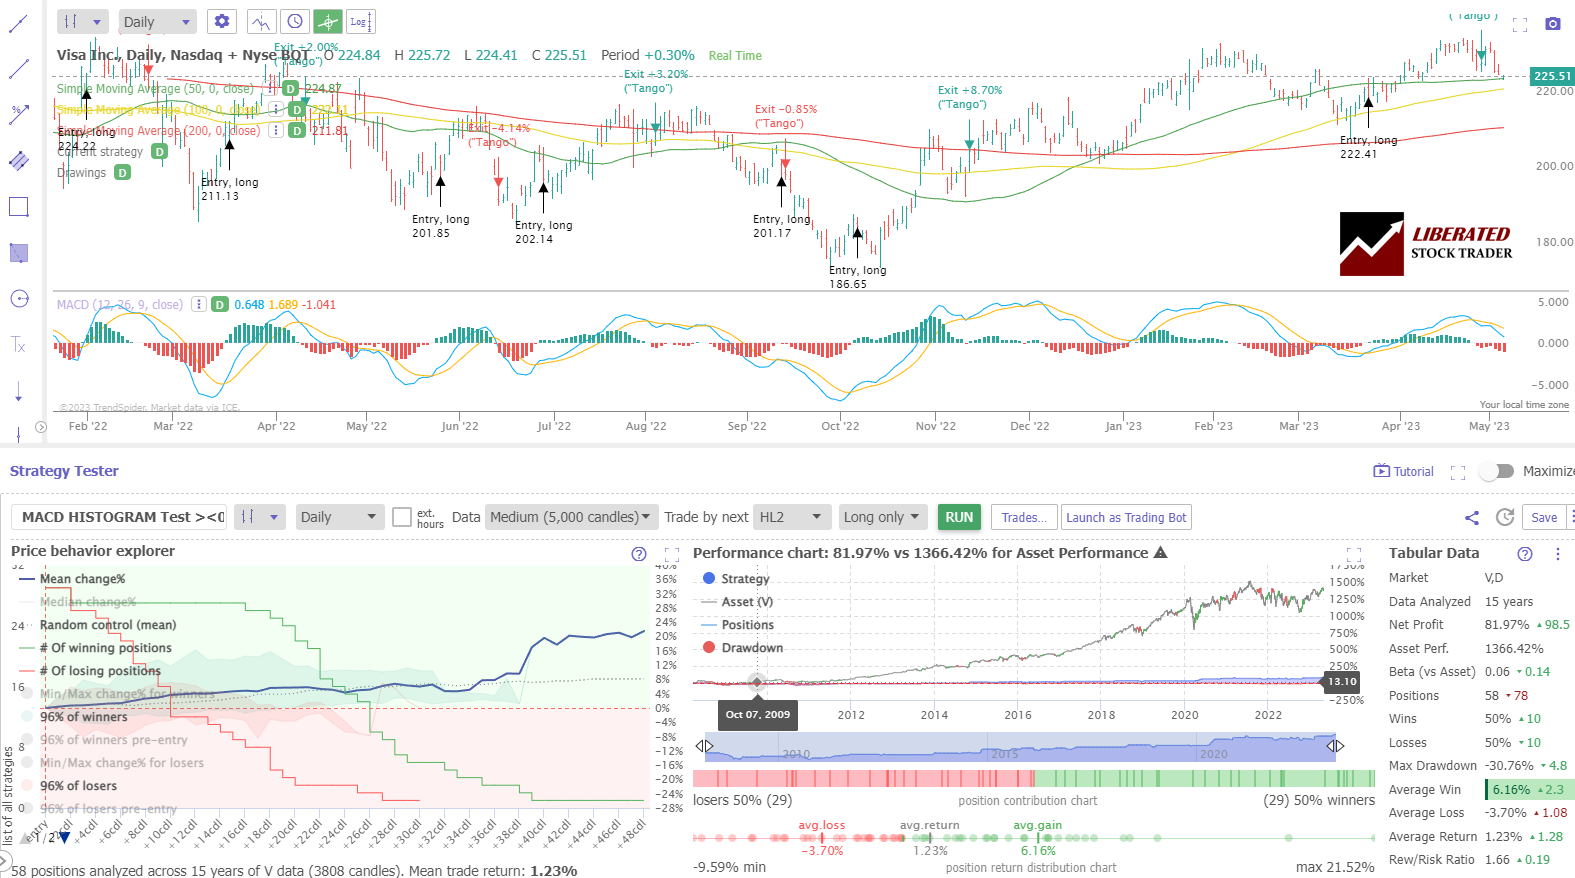
This backtesting example shows that MACD failed to beat a buy-and-hold strategy on Visa’s stock chart. A buy-and-hold investor would have made 1366%, whereas a trader would have made only 81%. The average win was 6.16%, and the average loss was 3.7%; these margins are too tight.
Testing Performed With TrendSpider
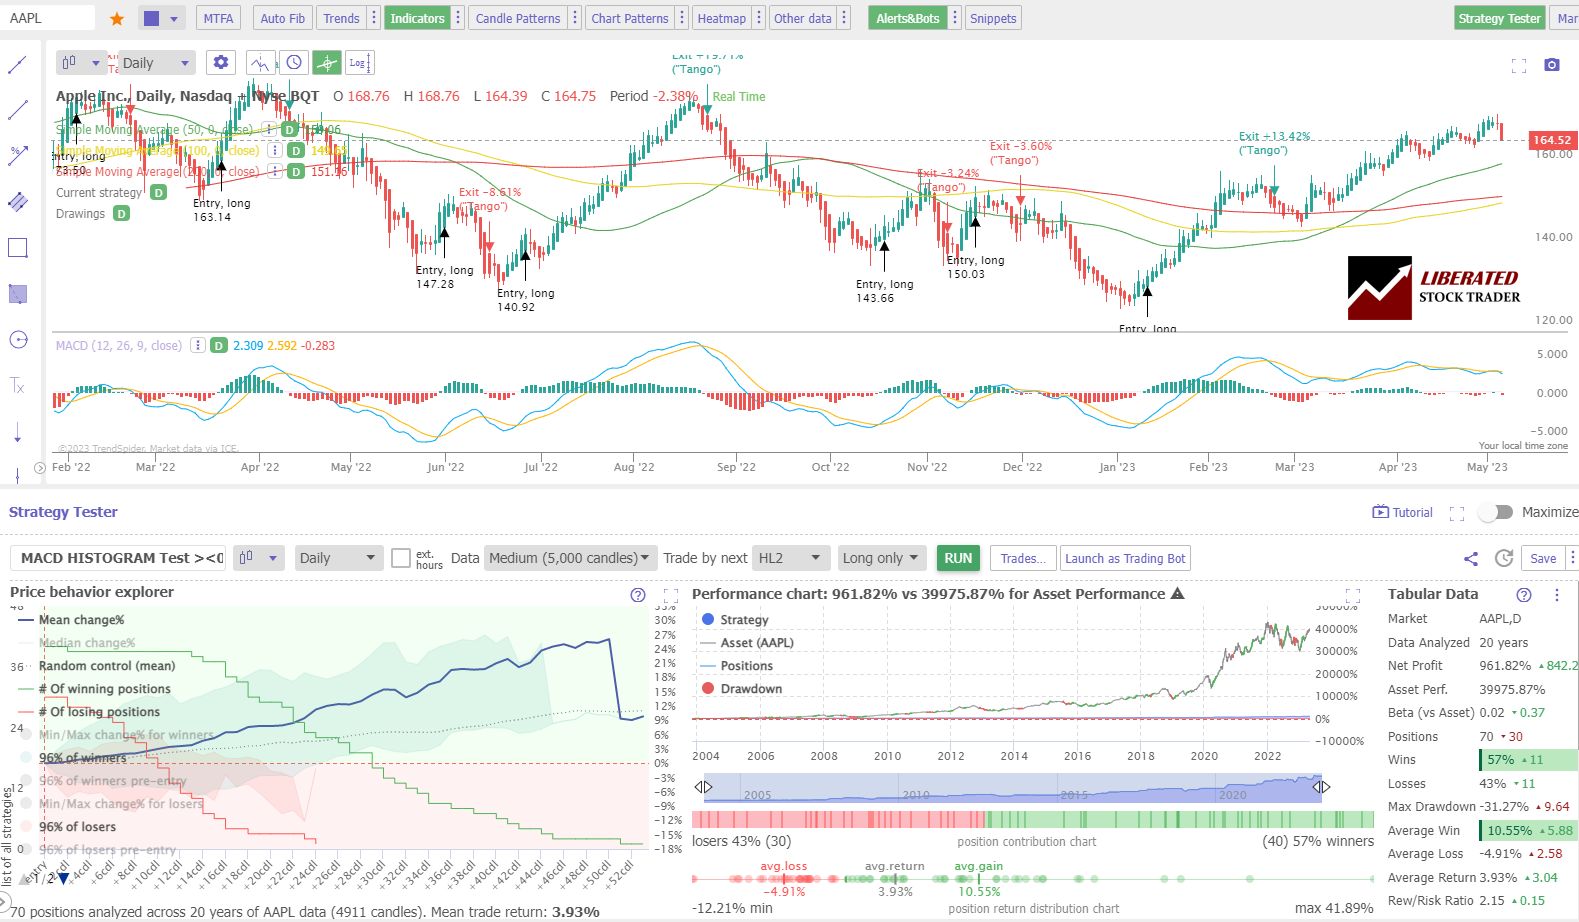
Testing MACD on a Daily Apple Inc. Chart: Example
Many indicators test better on a Heikin Ashi chart due to the smoothing effect on prices. But MACD’s performance is a lot worse. Over 20 years, a buy-and-hold investor would have made 39,975% with Apple, but a MACD trader would have made only 961%.
Get Pro Backtesting with TrendSpider
Why are Heikin Ashi’s MACD results better?
Why do Heikin Ashi charts perform slightly better with MACD and other indicators like Keltner Channels and Price Rate of Change? I believe it is because price averaging removes the extreme price highs and lows associated with traditional OHLC bars. This means fewer trades in consolidating markets and fewer small losses.
Professional traders may assume, as I did, that the Heikin Ashi chart distorts the pricing because it averages the OHLC of the candles. But we can achieve realistic entry and exit criteria by using TrendSpider’s HL2 setting, meaning the average of the price candle high and low. I proof-checked individual trades, and they were reasonable.
Combining MACD with Other Indicators
MACD should be combined with other chart indicators, such as Price Rate of Change or bullish chart patterns. For example, most indicators perform well when a stock is trending up or down. However, when the price consolidates, MACD provides many false buy and sell signals, causing small trading losses. Make sure not to trade this indicator in consolidating markets.
Can the MACD be used for Buy and Sell Signals?
Our research backtesting shows that the MACD is a poor indicator for identifying buy and sell signals. Over 20 years, it significantly outperformed a buy-and-hold strategy on 74% of the Dow Jones Industrial Index stocks.
The Best Settings for MACD
MACD is a poor indicator, so the best setting is the least worst. If you must use this indicator, use a daily chart and adjust the setting to match the asset you are trading. The asset must move in strong trends, and any periods of price consolidation will end in many small losses.
Frequently Asked Questions
How to read MACD?
To interpret a MACD chart, locate the MACD line crossing up through the signal line, indicating a buy signal. Conversely, when the MACD line crosses down through the signal line, it is a trend reversal signaling the need to exit a trade or sell short.
What is the best software for backtesting chart indicators?
Our detailed testing and research on chart indicators have been performed with TrendSpider, which I believe is the best trading software for backtesting and strategy development. Our list of backtesting software will help you make a choice.
How does MACD work?
MACD works very badly, according to my rigorous testing. In addition, I tested it against more robust indicators such as RSI and Stochastic Oscillators. These performed better than MACD in nearly all cases. The best way to use the MACD indicator is with other tools that may give a confirmation signal when using it alone could lead to false signals and unnecessary losses.
What is the MACD trading strategy?
The MACD trading strategy involves buying an asset or stock when the J line moves above the K and D lines. Traders can also use the opposite strategy to sell short or buy put options when the J line reverses and moves below the other lines. Beware, shorting strategies are far less profitable than long strategies in trading.
Does MACD really work?
No, according to our testing, MACD works out very poorly for anyone trading it on a daily or even intraday 5-minute chart. Using MACD on an intraday OHLC or Candlestick chart is a poor predictor of price trends and direction reversals.
How accurate is MACD?
The MACD indicator is extremely inaccurate, especially with a standard OHLC, line, or candlestick chart. Our research indicates that, on a daily or 5-minute chart, MACD has a loss rate of 97%. Although MACD is marketed as a good strategy, the rate of change indicator tends to be more effective.
How to make money trading the MACD system?
Our research demonstrates that making money using a MACD system is difficult, especially when day trading. 5-minute charts using MACD typically lose 74% of trades with a reward-to-risk ratio of less than 2, so it is nearly impossible to make money using MACD.
How to use MACD with Crypto or Forex?
You can use MACD with cryptocurrency or Forex trading, but our tests show the results are poor, with only a maximum success rate of 50%, and 64% of trades are losers. Whether you choose stocks, crypto, or forex for trading, you must avoid the MACD strategy or perform testing to optimize the settings.
Is MACD a good indicator?
No, our research shows that MACD is not a good indicator on standard settings using standard charts. It has a low success rate of 3 to 50%, with an average of 60% of losing trades.
What are better indicators than MACD?
There are many better indicators than MACD, such as the rate of change and Donchian Channels. Our testing has proven these indicators to be much more effective, work on many timeframes, and are more successful in trading strategies.
Is MACD the best indicator?
No, MACD is not the best indicator; it is one of the worst indicators in technical analysis. It has a low success rate and an average of 60% losing trades when trading the Dow Jones Industrial Average. If you want to be successful in trading, learn how to backtest trading strategies for yourself.
What is the best time frame for MACD?
The best timeframe for a MACD strategy is daily. We conducted time-based research and found that the MACD system underperformed the market on all timeframes from 5 minutes to daily charts. However, the MACD failure rate was slightly lower with daily charts.
How reliable is MACD?
MACD is an incredibly unreliable technical analysis chart indicator. Our 600 years of backtested data on 30 major US stocks show a 3% chance of beating a buy-and-hold strategy on a daily candlestick chart and a 26% chance on a 5-minute chart. Testing confirms it is an unreliable indicator and should be avoided.
What is the best software for trading and testing MACD?
Our rigorous analysis of MACD trading was executed utilizing TrendSpider, a leading trading software for backtesting and strategy development, in my professional opinion.
MACD Summary
The Moving Average Convergence Divergence (MACD) is a technical indicator used mostly to identify trends in trading.
Backtesting has shown that the MACD indicator is unreliable for buy-and-sell signals. It loses to a buy-and-hold strategy on the vast majority of stocks in the Dow Jones Industrial Index.
If a trader must use this indicator, they should set it up on a daily chart and be aware that it works best with assets with strong trends.
Traders should always perform backtesting and strategy analysis before trading any asset. TrendSpider is the best software for detailed trading strategy development and technical analysis. Read the TrendSpider review.


 Line Explained by a Certified Analyst")
