Traders utilize pivot point indicators to predict when stock prices will reverse direction. But does it work? I tested 66,480 trades on 210 years of data, and the results are surprising.
Join me as I unveil the truth behind pivot points and explain what everyone else is not telling you.
Key Takeaways
- Our testing shows pivot points are an unreliable indicator.
- Only 6% to 33% of stocks tested beat a buy-and-hold strategy.
- On average, 70% of traders were losers.
- Pivot points are falsely used to determine market trends and predict support and resistance levels.
- They reflect market sentiment and assist in developing trading strategies.
- Pivot points have inherent limitations.

Pivot Point Chart Indicator Testing & Research
Pivot Point Insights
Pivot points are derived from the previous day’s high, low, and closing prices and are used to anticipate support and resistance levels for the current trading day. By identifying these strategic points, traders can theoretically decide when to enter or exit a trade.
Inexperienced traders highly value these technical indicators because they offer a simplified view of the market sentiment. By analyzing pivot points, traders ascertain the bullish or bearish nature of the market. Pivot points’ versatility also allows them to be incorporated into various trading strategies, assisting traders in identifying the best possible entry and exit points. They apply across multiple timeframes and financial markets, allowing for a broad application in day trading, swing trading, and long-term investment strategies.
The use of pivot points has limitations. Market conditions and volatility render pivot points less effective. Additionally, relying solely on them without considering other indicators and market factors may lead to flawed trading decisions.
Understanding Pivot Points in Stocks
Pivot points are seen as a versatile tool in technical analysis, offering a glimpse into potential support and resistance levels that can guide trading decisions. However, our testing shows that perspective is misguided.
Definition and Importance
Pivot points are technical indicators used to determine overall market trends and specific price points that may act as barriers or targets for price movement. This indicator helps you understand where the price of a stock might encounter resistance, where it could face selling pressure or support, and where buying is likely to occur. The importance of pivot points lies in their ability to provide actionable levels based on previous market performance, which can be crucial for making informed trading decisions.
The pivot point calculation revolves around three key prices from the previous trading period: the high, low, and closing price. Here’s the basic formula:
- Pivot Point (P) = (High + Low + Close) / 3
Once the pivot point is established, you can calculate various support and resistance levels that may influence future trading.
Historical Context
Pivot points first gained prominence among floor traders, who needed a quick way to gauge the market direction and potential reversal points during the trading session. Over time, the adoption of pivot points spread beyond the trading pits, and they became a staple for various market participants.
While initially calculated using daily data points, pivot points have adapted to many time frames, suiting different trading styles from intraday to long-term. This adaptability and historical relevance bolster the credibility of pivot points as an enduring and valuable indicator.
In your utilization of pivot points, remember they are a guide, not a definitive predictor. The reliability of pivot points can vary, and they are best used with other technical analysis tools to inform your trading strategy.
Do Pivot Point Indicators Work?
No, according to our 66 thousand trades on 210 years of data, pivot point indicators are poor performers. Only 16% of stocks traded beat a buy-and-hold strategy. With an average of 70% losing trades, pivot points should be avoided.
Our Pivot Point Indicator Testing
I tested standard pivot points (using TradingView) and reversal pivot points (with TrendSpider), and the results were poor.
Based on our extensive analysis of 66,480 trades spanning 210 years, pivot point indicators demonstrate subpar performance. Only 16% of the stocks traded outperformed a buy-and-hold strategy. With an average of 70% losing trades, avoiding relying on pivot points is advisable.
Pivot Point Indicator Test Results.
| Tool | Indicator | OHLC Chart | Duration | % Stocks Beating Buy-and-Hold | Avg # Trades | % Trade Winners | % Trade Losers | Total Trades |
| TrendSpider | Pivot Points (STD) | 1-hour | 20 months | 33% | 188 | 30% | 70% | 5,640 |
| TrendSpider | Pivot Points (STD) | 5-min | 2 months | 6% | 49 | 18% | 82% | 1,470 |
| TradingView | Pivot Reversal Strategy | 5-min | 2 months | 10% | 950 | 35% | 65% | 28,500 |
| TradingView | Pivot Reversal Strategy | 1-hour | 20 months | 13% | 1029 | 36% | 64% | 30,870 |
| Totals | 16% | 554 | 30% | 70% | 66,480 |
The test results of pivot points are poor, with only 33% of stocks beating a buy-and-hold strategy on a 1-hour chart and only 6% on a 5-minute chart. On average, 70% of trades, based on 66,480 trades, resulted in losses. These results demonstrate that pivot points are not a reliable trading strategy and should be avoided.
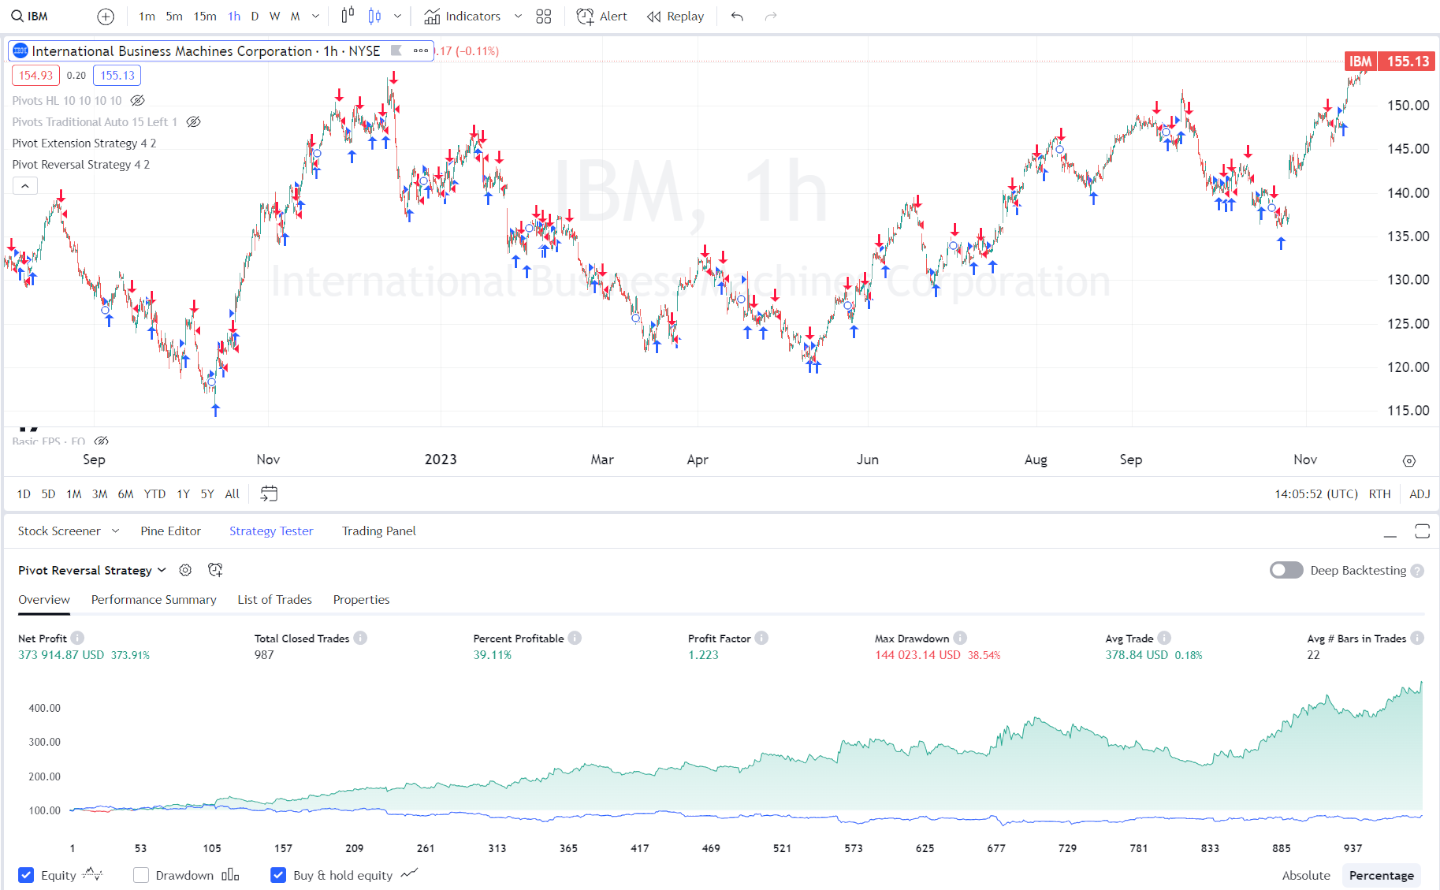
Pivot Point Indicator Performance Example: IBM
Here is a rare example of a pivot point reversal strategy resulting in a profitable outcome. TradingView’s powerful backtesting shows that this strategy was successful over 24 months on a 60-minute IBM chart. However, the problem with pivot points is that there are so many losing trades. The chart below shows that this stock was a winner, but it only had 39.11% of winning trades, meaning 61% of trades were losers. This is a clear sign of a poor indicator.
Global Charting & Trading with TradingView
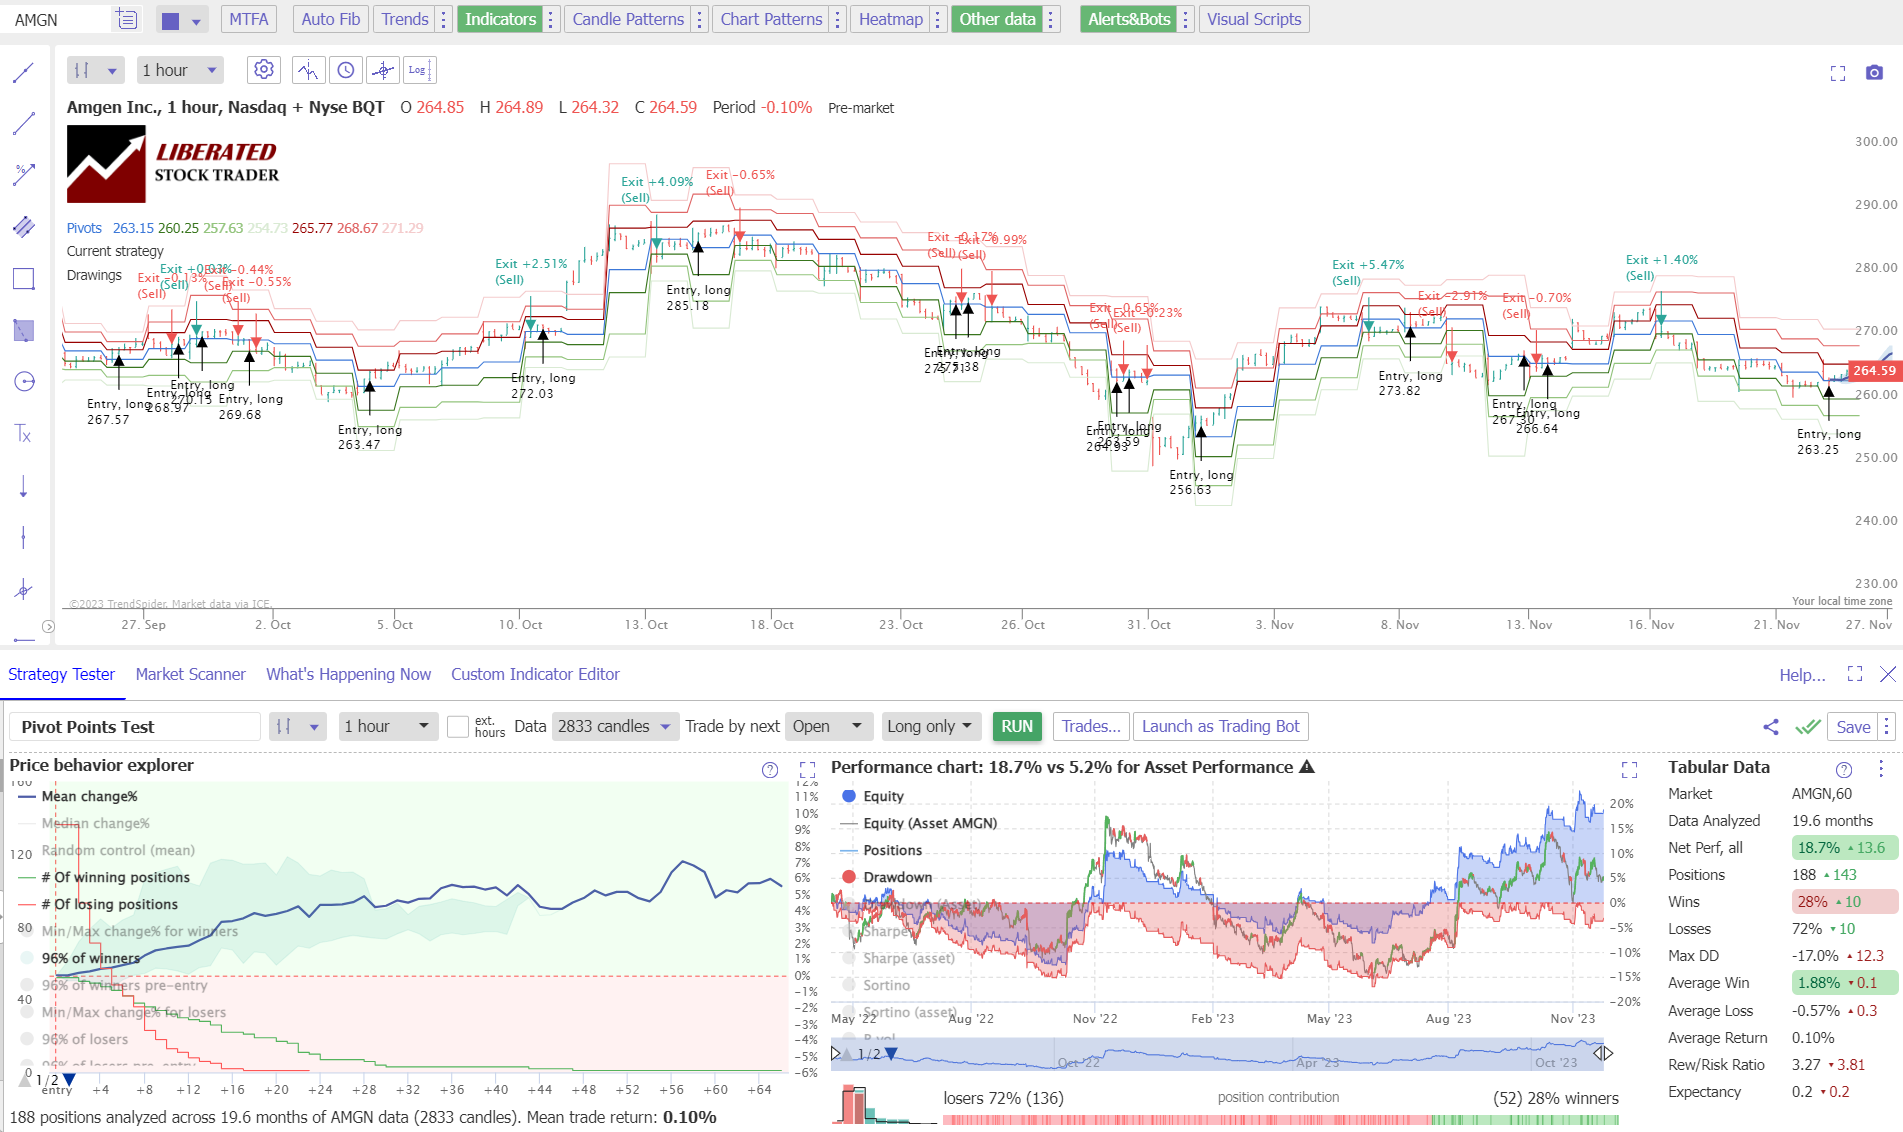
Pivot Point Indicator Results: AMGEN
Here’s one of the few examples of a pivot point reversal strategy that yielded a profitable outcome. By utilizing TrendSpider’s exceptional backtesting feature, we observed 2 months on a 5-minute AMGN chart. Again, pivot points suffer from the downside of having numerous losing trades. As evidenced by the chart below, while this particular stock emerged as a winner, only 28% of the trades were successful, and 72% ended in losses. This is a subpar indicator.
Try Awesome Trade Automation with TrendSpider
Why are Pivot Point Indicators Unprofitable?
Pivot point indicators are often unprofitable due to market volatility, resulting in 70% of trades being losers because the pivot points did not hold. In other words, the markets often experience sudden and unpredictable shifts in direction that cannot be anticipated. Additionally, pivot points are too sensitive to changes in momentum.
As traders, it’s important to understand what works for us and what doesn’t. Knowing and understanding our edge is key to profitable trading results. While a pivot point reversal strategy may have yielded success with AMGN, it’s important to remember that it does not work across all stocks or timeframes.
Experimentation is essential in finding an optimal trading solution that fits your style and preferences. If you invest the time, you can find a winning strategy. This leads me nicely to the topic of how to backtest indicators.
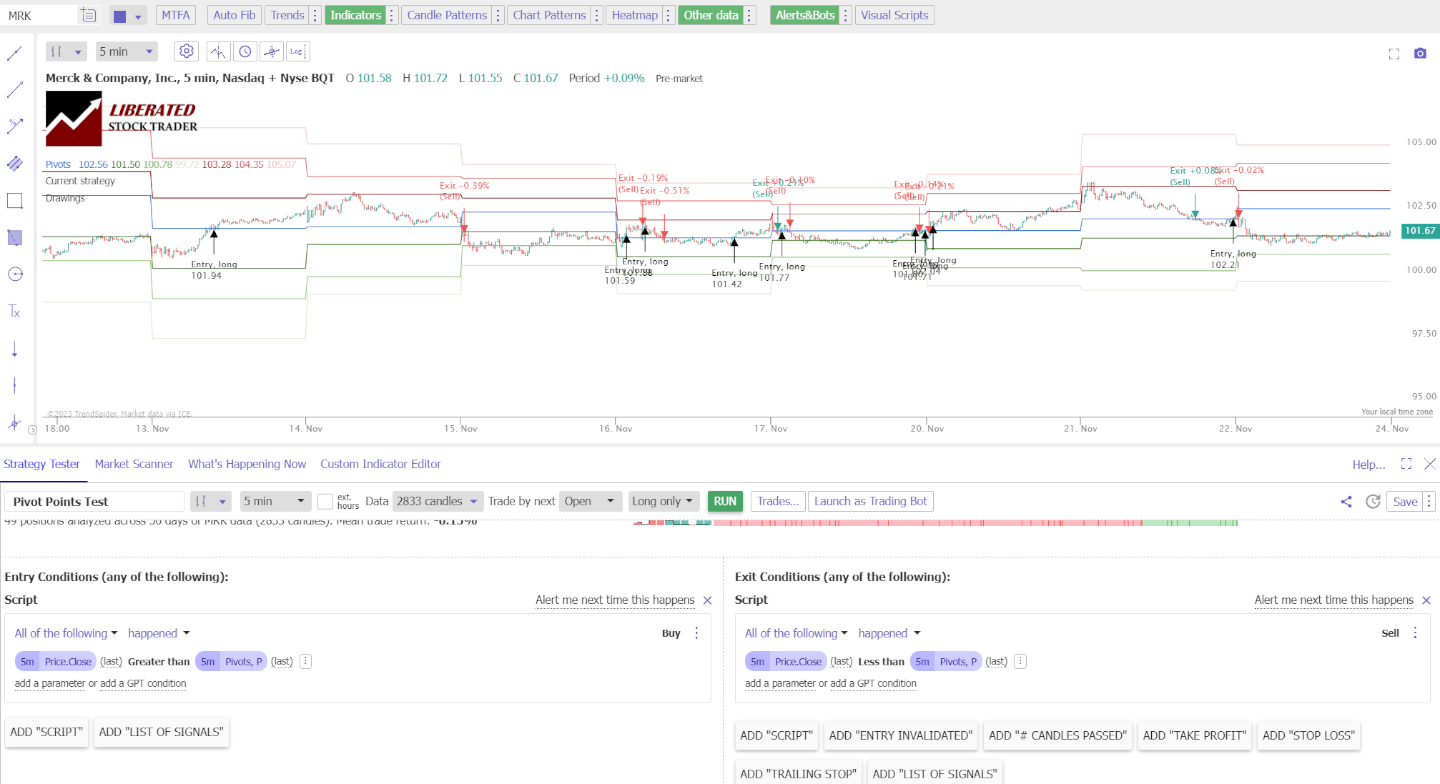
How to Test a Pivot Point Indicator
To set up Pivot Point backtesting in TrendSpider, follow these steps.
- Register for TrendSpider
- Select Strategy Tester > Entry Condition > Add Script > Add Parameter > Condition > Price.Close > Above > Pivot.P
- For the Sell Criteria, select > Add Script > Add Parameter > Condition > Price.Close > Less Than > Pivot.P
- Finally, click “RUN.”
AI Trading Automation with TrendSpider
Calculating Pivot Points
Pivot points are a valuable tool for traders to determine market trends and potential support and resistance levels based on previous high, low, and closing prices. These calculations help guide intraday and day trading decisions.
Standard Pivot Point Formula
The Standard Pivot Point formula is the most commonly used method to calculate Pivot Points. The pivot point (PP) itself is the average of the high (H), low (L), and closing price (C) from the previous trading session:
PP = (High + Low + Closing Price) / 3
Once you calculate the basic pivot point, the associated support and resistance levels are derived from this central pivot:
- First Resistance (R1): (2 * PP) – Low
- First Support (S1): (2 * PP) – High
- Second Resistance (R2): PP + (High – Low)
- Second Support (S2): PP – (High – Low)
The high, low, and closing Price values should be from the most recent trading session during standard trading hours.
Alternative Pivot Point Formulas
Beyond the standard method, several alternative formulas can offer different insights:
- Fibonacci Pivot Points: These use the same calculation for the central pivot point but apply Fibonacci retracements to define support and resistance levels. Fibonacci is also an unprofitable indicator.
- Camarilla Pivot Points: They estimate potential reversals based on the previous day’s volatility and are popular for their precision within the intraday frame. Camarilla also does not work according to our research.
- DeMark Pivot Points: DeMark’s formula prioritizes recent price behavior and is well-suited for markets with a clear directional trend.
Each alternative method may provide a more nuanced view in different market conditions or time frames.
Relevance to Different Time Frames
When applying pivot point calculations:
- Intraday Trading: Traders usually use the daily data from the previous day to calculate the pivot points for the current day’s trading.
- 24-Hour Markets: For markets such as Forex, pivot points can be calculated using 24-hour data, accounting for the market’s continuous nature.
Remember that pivot point calculations are more a reflection of past price behavior than a predictor of future activity. They serve best as a guide in conjunction with other indicators and strategies.
Pivot Points and Market Sentiment
Pivot points serve as indicators for evaluating market sentiment and identifying potential trend reversals. By observing the interaction of stock prices with established pivot levels, you can gauge the collective market psychology around bullish and bearish trends.
Gauging Bullish and Bearish Trends
When a stock’s price rises above a pivot point, it suggests bullish sentiment, and traders may interpret this as a signal to enter long positions. In this context, pivot points act as a support level, underscoring a positive outlook for the trend direction. Conversely, if the price falls below a pivot point—which now becomes a resistance level—it signifies bearish sentiment. Here, traders might consider short selling, anticipating further declines. It’s essential to closely monitor these pivot-triggered transitions to understand the prevailing market trend.
- Bullish Trend Indicators: Price > Pivot Point
- Bearish Trend Indicators: Price < Pivot Point
Pivot Points as Psychological Barriers
Pivot points represent mathematical averages and psychological barriers in the market. A stock lingering just below a pivot point suggests that bearish sentiment is strong, placing pressure on the support level. If the price breaches this pivot point upwards, it can become a resistance level where traders might set profit targets or assess the strength of the market’s bullish sentiment. These levels could also act as decisive factors for trend reversals, signaling shifts in the market trend that can lead to a reevaluation of trading strategies.
- Pivot Point Breach:
- Upward Breach – New Resistance Level
- Downward Breach – New Support Level
Understanding pivot points and their impact on market sentiment is crucial for trading decisions. It allows you to navigate support and resistance levels with a clear view of potential entry and exit points.
Trading Strategies with Pivot Points
Pivot points serve as a predictive indicator of movement in the stock market, offering crucial support and resistance levels. Traders, especially day traders, use these points to identify potential entry and exit positions to maximize their trading strategies.
Identifying Entry and Exit Points
You can calculate pivot points for any given time frame to highlight potential entry and exit points. Entry points are typically set near the pivot line (also known as the pivot point) or one of the support or resistance levels (Support 1 (S1) or Resistance 1 (R1)). On the other hand, exit points may be identified when the price approaches these levels again, suggesting a reversal.
Pivot Points in Trend Trading
When trading with the trend, you should look at the market’s direction and use pivot points to guide your trades. If the market is trending upward, consider buying at or above a support level. Conversely, if the trend is downward, you might look to sell at or just below a resistance level.
Breakout and Bounce Trades
Pivot point breakouts occur when the price moves through a pivot level significantly, which can be a signal to enter a trade in the direction of the breakout. Meanwhile, pivot point bounces involve entering a trade as the price bounces off a pivot level, typically a form of support or resistance, indicating the price might continue in the prevailing trend.
Setting Stop-Loss and Profit-Taking Levels
Strategically using stop-loss orders is vital for risk management. Set your stop-loss just below a support level or above a resistance level, depending on whether you are long or short. For profit-taking, you could set a limit order at the next pivot level, up in the case of a buy or down in the case of a sell, to close your position automatically once a target is reached.
Pivot Points Across Financial Markets
Pivot points are a versatile tool misused by traders across various financial markets to identify potential support and resistance levels.
Pivot Points in Forex Trading
In the forex market, pivot points are particularly valuable due to the 24-hour nature of trading. You can calculate daily pivot points based on the previous trading session’s high, low, and close. Day traders in Forex utilize these levels to make quick, informed decisions about entries and exits.
- R1, S1 (first resistance and support): Traders watch these for initial price action.
- R2, S2: These levels can serve as breakout indicators in forex trading.
- Pivot Point: The baseline from which support and resistance levels are derived.
Application in Commodities Trading
Commodities traders also apply pivot points, leveraging them in markets like oil or gold. The indicators help them understand the market sentiment in these markets, which are often characterized by swift price movements.
- High Volatility: Pivot points can offer structure in the sometimes erratic commodities markets.
- Extended Time Frame Pivots: Some traders in commodities may use weekly or monthly pivots to accommodate longer-term trends.
Usage in Equity Markets
Stock traders use pivot points to gauge market direction and potential reversals in the equity markets. These can be especially useful for identifying entry and exit points in the fast-paced day trading environment.
- E-mini Contracts: Pivot points are widely used for short-term forecasting in these futures contracts based on the S&P 500 stock index.
- Individual Stocks: Traders apply them to each stock’s unique price action, providing a personalized approach.
Pivots act as signposts within the bustling world of financial exchanges, helping you navigate the movements of Forex, commodities, and equity markets with greater confidence.
Limitations of Pivot Points
I have proven that pivot points do not work on a 5-minute and 60-minute timeframe, losing 70% of the time and failing to beat a buy-and-hold strategy 66% of the time. According to our testing, another pivot point indicator, Fibonacci retracement, is equally unreliable.
Pivot points are an incredibly poor technical analysis indicator. Despite what other self-proclaimed day traders say, the data proves pivot points are nearly worthless. Day traders frequently utilize pivot points due to their adaptability to short time frames, perhaps that is why many day traders lose money.
Pivot Points Summary
In conclusion, pivot points are not a dependable technical analysis tool and should not be used in trading decisions. The data shows that pivot points fail to beat a buy-and-hold strategy 66% of the time and lose 70% of the time when used on a 5-minute and 60-minute timeframe. Fibonacci retracement is just as unreliable, and day traders who frequently utilize pivot points are likely to make losses. It is best to use other methods of technical analysis that have been proven more reliable, such as Bollinger Bands or candlestick patterns, to make more informed trading decisions.
Frequently Asked Questions
How do you calculate pivot points when trading stocks?
To calculate pivot points, you take the high (H), low (L), and close (C) from the previous trading session and compute the Pivot Point (P) using the formula: P = (H + L + C) / 3. Support and resistance levels are then derived from this pivot value.
What indicates a buy signal using pivot points?
A buy signal is typically indicated when a stock's price moves above the Pivot Point or a resistance level (R1, R2, R3), suggesting an upward trend. Traders often wait for confirmation such as increased volume or price staying above these levels before entering a trade.
Which pivot point indicator is most effective for intraday trading?
For intraday trading, the standard pivot point indicator is commonly used for its simplicity and effectiveness. It provides a central pivot point surrounded by multiple support and resistance levels which are crucial for short-term market movements.
Do professional traders use pivot points?
No, while pivot points are used by many traders, the majority of professional traders use other more reliable technical analysis tools such as Price Rate of Change and the Commodity Channel Index for their market analysis. Pivot points are unreliable.
What is the best time frame for using pivot points?
According to our testing there is no best timeframe for pivot points because it is an unreliable indicator.
How can pivot points be applied to swing trading?
In swing trading, pivot points can serve to identify the overall trend over multiple days and help in setting target prices and stop-loss levels. Traders may use pivot points to detect potential reversals and the strength of market movements.
What do the R1, R2, and R3 levels in pivot points signify?
The R1, R2, and R3 levels represent potential resistance levels where the stock's price may face selling pressure. These are calculated above the central Pivot Point and act as barriers to upward price movement; each level indicates a higher degree of resistance.


 Line Explained by a Certified Analyst")
