Elite Stock Investing Starter Guide by LiberatedStockTrader
Updated annually, our Elite Stock Market Beginner's Guide" is different because it is based on tested and researched data. We have researched hundreds of charts, indicators, and patterns and know which ones work.
Understanding Business Efficiency with Total Asset Turnover
Total asset turnover is a financial metric used to assess a company's efficiency in using its assets to generate sales. It is a vital ratio for investors and analysts seeking to understand how well a company utilizes its asset base to produce revenue.
Investors Guide to the Debt-to-Capital Ratio with Examples
The debt-to-capital ratio measures a company's financial stability and leverage by comparing its total debt to its capital base, including debt and equity. It provides insight into what proportion of a company's operations is financed by debt versus shareholders' equity.
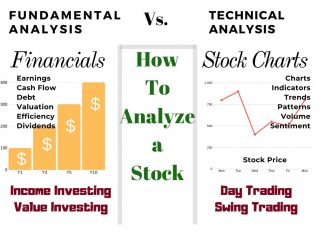
How To Analyze Stocks with Fundamental & Technical Analysis
There are two ways to analyze stocks. Fundamental analysis, which evaluates criteria such as PE ratio, earnings, and cash flow. Technical analysis, which involves studying charts, stock prices, volume, and indicators.
An Investors Guide to Economic Value Added (EVA)
Economic value added, or EVA is a sophisticated measure for assessing a company's financial performance and creating shareholder wealth by measuring the residual income after deducting the cost of capital.
How Financial Leverage Works! How Debt Amplifies Returns
Financial leverage refers to using borrowed funds to increase the potential return on investment. It magnifies potential gains and losses, vital to a company's capital structure.
An Investors Guide to Income Elasticity & Consumer Behavior
Income elasticity of demand is an economic measure showing how demand responds to consumer income changes. This metric helps businesses and economists understand how economic changes affect the demand for goods.
Inventory to Sales Ratio Explained: Optimizing Stock Management
Inventory to Sales Ratio is a crucial financial metric indicating the relationship between a company's inventory and sales volume. It sheds light on the efficiency of inventory management and plays a significant role in assessing performance against industry benchmarks.
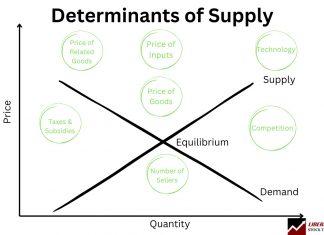
Determinants of Supply: Key Factors Explained with Examples
The determinants of supply are crucial in economics, forming the foundation of functioning markets and the economy. Key determinants of pricing, labor, taxes, competition, suppliers, and technology cause the supply of goods and services to change.
Cash on Hand Explained: Cash is King for Businesses & Investors
Cash on Hand is a financial metric indicating the amount of liquid capital available to an individual or business. For businesses, it includes physical currency, funds in bank accounts, and liquid assets readily convertible to cash.
A Smart Investors Guide to Reading Balance Sheets
To read a balance sheet effectively, start by focusing on three main sections: assets, liabilities, and equity. Assets represent what the company owns, liabilities show what the company owes, and equity reflects its net worth.
Investors Guide to the PEG Ratio & Finding High Growth Stocks
The Price/Earnings to Growth (PEG) ratio helps investors find growth at a reasonable price. The PEG ratio is an incredibly valuable metric calculated by dividing the Price-to-Earnings (P/E) ratio by the company's earnings growth rate.
Investors Guide to the Dividend Payout Ratio & Sustainability
The payout ratio is expressed as a percentage of the company's total earnings, reflecting the proportion allocated to dividend payments instead of being reinvested in the business or used for other purposes.
The Impact of Price Floors & Ceilings on Market Equilibrium
A price floor is a government-imposed limit on how low a price can be charged for a product, service, or commodity. This is designed to ensure the price stays high enough to protect the interests of producers, often at a point above the natural market equilibrium where supply equals demand.
Investors Guide to the Times Interest Earned Ratio
The Times Interest Earned Ratio assesses the number of times a company could cover its interest payments with its current pretax earnings. It offers a clear view of financial health, particularly regarding solvency and risk.
What Does Over-Leveraged in Finance & Investing Mean?
Over-leverage is using excessive debt to finance investments or business operations, leading to excessive risk. Financial risk increases as the level of debt exceeds the ability to generate sufficient returns to cover the interest payments and principal repayment obligations.
Investors Guide to the Fixed Charge Coverage Ratio (FCCR)
FCCR is a financial metric determining how well a business can cover its fixed charges with its operating income. It is calculated by dividing Earnings Before Interest and Taxes (EBIT) by fixed charges. Fixed charges typically include expenses such as interest expense and lease payments.
An Investors Guide to Dupont Analysis with Examples & Formulas
By breaking down ROE into profitability, efficiency, and leverage factors, DuPont Analysis allows investors and analysts to pinpoint the strengths and weaknesses in a firm's financial health.
A Practical Investors Guide to Return on Common Equity (ROE)
Return on Common Stockholder's Equity (ROCE) is a financial ratio measuring the profitability relative to the common equity shareholders have invested in a company.
An Investors Guide to Operating Profit Margin with Examples
Operating Profit Margin, often represented as a ratio or percentage, reflects the proportion of revenue after accounting for the costs and expenses associated with a company's primary operations.
Our Best Training & Strategies
Liberated Stock Trader Pro: Learn Stock Market Investing
Learn stock market investing with the complete online stock trading course by Barry D. Moore, a certified financial analyst from the International Federation of Technical Analysts (IFTA).
ETF Investing Strategy: MOSES Improves Performance & Lowers Risk
The MOSES ETF investing strategy is a powerful suite of indicators meticulously backtested over 100 years. Designed to empower you to outperform the market, it equips you with the tools to navigate major stock market crashes and unlock greater investing performance.
LiberatedStockTrader’s Strategy Beat the Market By 102%
Decades of research and testing unveiled the Liberated Stock Trader Beat the Market System. Our 9-year, backtested, and proven strategy targets 35 financially healthy high-growth stocks, producing a track record of beating the S&P 500 by 102%.

