
Chart IndicatorVideos
Our library of chart indicator videos contain original research into their accuracy and profitability. Its a valuable resource for investors and traders.

Mastering Trading with the McClellan Oscillator: Your Key to Success!
03:18

Discover the Ultimate KST Indicator Settings & Strategy - Proven on 2746 Trades!
02:34
How to Trade the DMI Indicator Based on 9,764 Tested Trades
03:35
How to Trade Volume Profile Indicators Like a Pro Trader
04:33
Testing the ATR Indicator: Settings, Reliability, and Real-World Usage Explained
04:10
Does the VWAP Chart Indicator Strategy Work?: We Test 13,681 Trades! 📈
05:48
I Backtest the Donchian Channels Indicator for Profitability. Is It Worth Using?
03:57
Is the Supertrend Indicator Really Super? We Dive into 4,052 Backtested Trades!
04:35
The ADX Indicator: The Best Settings for Profitability Backtested with 5,000 Years of Data
03:33

How to Trade the OBV Indicator Explained: For Pro Traders Only
04:02

The Pivot Point Chart Indicator, How Does It Work & Is It Profitable?
05:06
10 Best Indicators for Day Trading: 10,400 Years of Tests Show the Best Settings!
06:07
The Volume Indicator In Trading: How to Use Volume For Better Trades
03:52

Are Keltner Channels Worth Trading? Our 1800 Years of Test Data Reveals All.
03:50
10 Best Free TradingView Indicators for Traders - Tested
06:37

5 Best Moving Averages for Traders Compared and How to Trade Them!
04:15

The 200-Day Moving Average Explained: Is it a Profitable Indicator? We Test It!
03:17

Bollinger Bands Indicator: The Best Setting & How To Trade It
02:30

Commodity Channel Index: How to Trade this Highly Profitable Indicator
02:36
Stochastic Oscillator Explained: 399 Years Of Test Data Reveals Surprising Results. Must Watch.
03:28

Is the Aroon Indicator Reliable & How To Trade It? I Test 13,360 Years of Data to Find the Truth!
03:03
Money Flow Index Explained & Proven Reliable & Accurate Over 1396 Years of Backtested Data!
02:48

Heikin Ashi Charts: 360 Years of Reliability, Accuracy & Trading Testing
02:22
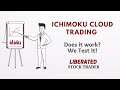
Ichimoku Cloud Indicator Explained: 600 Years of Backtesting Data Says Avoid this Indicator
01:47

Rate of Change (ROC) Indicator Explained: Testing Shows a 66% Success Rate. Learn How to Trade It.
01:52
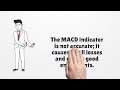
MACD Indicator Reliability Tested: 360 Years of Data Reveals Why Traders Must Avoid MACD!
02:13
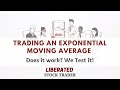
Exponential Moving Average: Mythbusting with 960 Years of Data!
01:58
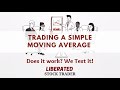
How to Trade Simple Moving Averages: Best Settings & Strategy Based on 960-Year Test
02:30
RSI Indicator: 820 Years of Data tested! Is RSI The Best Way to Trade Stocks?
02:19

Parabolic SAR: How to Trade this Indicator Profitably Based on 2,880 Years of Data
02:54

Weighted Moving Averages: 960 Years of Test Data Says Avoid this Indicator
01:41

Hull Moving Average: 960 Years of Data Backtested to Reveals Indicator Performance
01:39

Is the KDJ Indicator Worth It? I Backtest KDJ for 600 Years & Find the Best Settings
01:45