What is a Stock Split and How to Trade It?
In a stock split, a company divides its existing shares into multiple shares to increase liquidity. A reverse stock split combines several shares into one to reduce outstanding shares.
Leading Indicators: Super-Charging Your Investing Strategy
Leading indicators are predictive signals that forecast future economic activity and market trends, allowing investors to anticipate changes before they occur.
Reverse Stock Splits Explained & How to Profit From Them
Reverse stock splits are typically undertaken by companies seeking to boost their stock price by reducing the number of outstanding shares. Often seen as a sign of weakness, it attracts short-sellers attempting to profit from statistically proven future price declines.
What Does Over-Leveraged in Finance or Investing Mean?
Over-leverage is using excessive debt to finance investments or business operations, leading to excessive risk. Financial risk increases as the level of debt exceeds the ability to generate sufficient returns to cover the interest payments and principal repayment obligations.
What is Stock Float: How to Find, Calculate & Trade Float
Stock float is the number of shares available to trade in the public market. This includes all shares held by institutional and retail investors and restricted stock owned by insiders. Float can impact a stock's trading volume, price movements, and volatility.
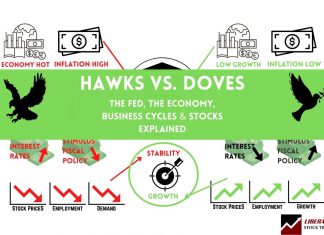
Hawk vs. Doves Explained: How Fed Decisions Impact Investors
Hawks and doves are distinct camps in economics regarding fiscal policy. Hawks lean toward tight monetary policy (high interest rates, low government spending), while doves prefer loose monetary policy (low interest rates, high government spending).
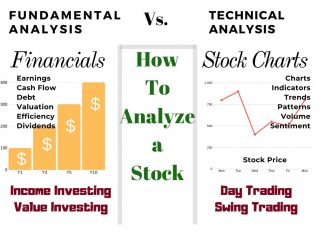
How To Analyze Stocks with Fundamental & Technical Analysis
There are two ways to analyze stocks. Fundamental analysis, which evaluates criteria such as PE ratio, earnings, and cash flow. Technical analysis, which involves studying charts, stock prices, volume, and indicators.
5 Proven Ways To Find The Best Cheap Stocks to Buy...
The best way to find cheap stocks is by using future earnings, asset valuation, discounted cash flow, fair value, and the margin of safety. Do not look at stock price alone to assess if a stock is undervalued; stock price is only useful in combination with other criteria.
102-18 Cash Flow Statement Explained with Examples & Ratios
Cash flow is the lifeblood of a company, and the cash flow statement shows how much money was generated and spent during a given period, which makes it invaluable for investors looking to invest in a company.
Is The Stock Market Overvalued? The Data Says Yes!
According to the Shiller PE Ratio, the US stock market is currently 19.2% overvalued compared to its 200-month moving average. Currently, the PE ratio of the S&P 500 is 31, and the 10-year average is 26.
P/E Ratio: Use the Price to Earnings Ratio Like a Pro...
The Price to Earnings Ratio is a commonly misunderstood calculation for determining a company's relative value. The PE Ratio is only useful for comparing companies in the same industry with similar business models. It should not be used to compare radically different businesses.
Using Fundamental Analysis to Find Great Stocks
The core objective of fundamental analysis is to determine a stock's true or intrinsic value. This involves assessing the company's financial performance, industry comparisons, and economic factors.
How to Calculate Stock Beta: Formula & Examples Explained
To calculate Beta or (β) you need to divide the variance of an equity's return by the covariance of a stock index's return.
A Smart Investors Guide to Reading Balance Sheets
To read a balance sheet effectively, start by focusing on three main sections: assets, liabilities, and equity. Assets represent what the company owns, liabilities show what the company owes, and equity reflects its net worth.
How to Read Financial Statements for New Investors
The three main types of financial statements are the balance sheet, income statement, and cash flow statement. Each one provides a different perspective on a company's finances.
How to Read the Income Statement Like a Pro Investor
Investors use the income statement to understand a company's key metrics, revenue, expenses, profit, and operating costs. It is one of the most important documents investors use to understand a company's financial performance.
How to Calculate Intrinsic/Fair Value of Stocks + Excel Calculator
To calculate the intrinsic value of a stock, estimate a company's future cash flow, discount it by the compounded inflation rate, and divide the result by the number of shares outstanding. The result is a stock's fair value.
How to Calculate Dividend Yield & Triple Your Profits
To calculate dividend yield, divide the stock's annual dividend per share by the stock's current market price. The dividend yield increases as share prices drop, so to triple your yields, buy stock price panic crashes.
Earnings Per Share: EPS Growth & Acceleration In Investing
EPS or earnings per share is a measure of profitability. It tells investors how much profit a company makes for each share of its stock. The higher the EPS, the more profitable the company is.
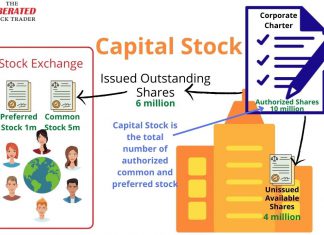
What is Capital Stock? Examples & Use In Research
Capital stock, also called authorized shares or authorized capital, is the maximum number of shares a company can issue to shareholders. A corporation's charter declares the number and type of stock it can issue, so no more than this amount can be issued.
Our Best Training & Strategies
Liberated Stock Trader Pro: Learn Stock Market Investing
Learn stock market investing with the complete online stock trading course by Barry D. Moore, a certified financial analyst from the International Federation of Technical Analysts (IFTA).
ETF Investing Strategy: MOSES Improves Performance & Lowers Risk
The MOSES ETF investing strategy is a powerful suite of indicators meticulously backtested over 100 years. Designed to empower you to outperform the market, it equips you with the tools to navigate major stock market crashes and unlock greater investing performance.
Our LST Strategy Beat the Stock Market’s S&P 500 By 102%...
Decades of research and testing unveiled the Liberated Stock Trader Beat the Market System. Our 9-year, backtested, and proven strategy targets 35 financially healthy high-growth stocks, producing a track record of beating the S&P 500 by 102%.

