You can read candlestick charts using pattern recognition software to identify five reliable patterns, the Inverted Hammer, Bearish Marubozu, Gravestone Doji, Bearish Engulfing, and Bullish Harami Cross.
To read candlesticks, you must interpret how the body and wick length translate into price action and trading psychology. Knowing which candles are reliable in bull and bear markets also helps.
This in-depth article will explain candlestick charts, how to interpret them, and their importance in trading. We’ll also provide tips on spotting reliable patterns to help you make successful trades and avoid losses.
What are Candlestick Charts?
Candlestick charts are a tool in technical analysis that represents the supply and demand of an asset in a more visual way than a standard line chart. A single candlestick represents time and a rich depiction of price in trading activity.
Candlestick charts, developed in the 18th century by a Japanese rice trader, have become one of the most popular charts in technical analysis.
What are Candlesticks?
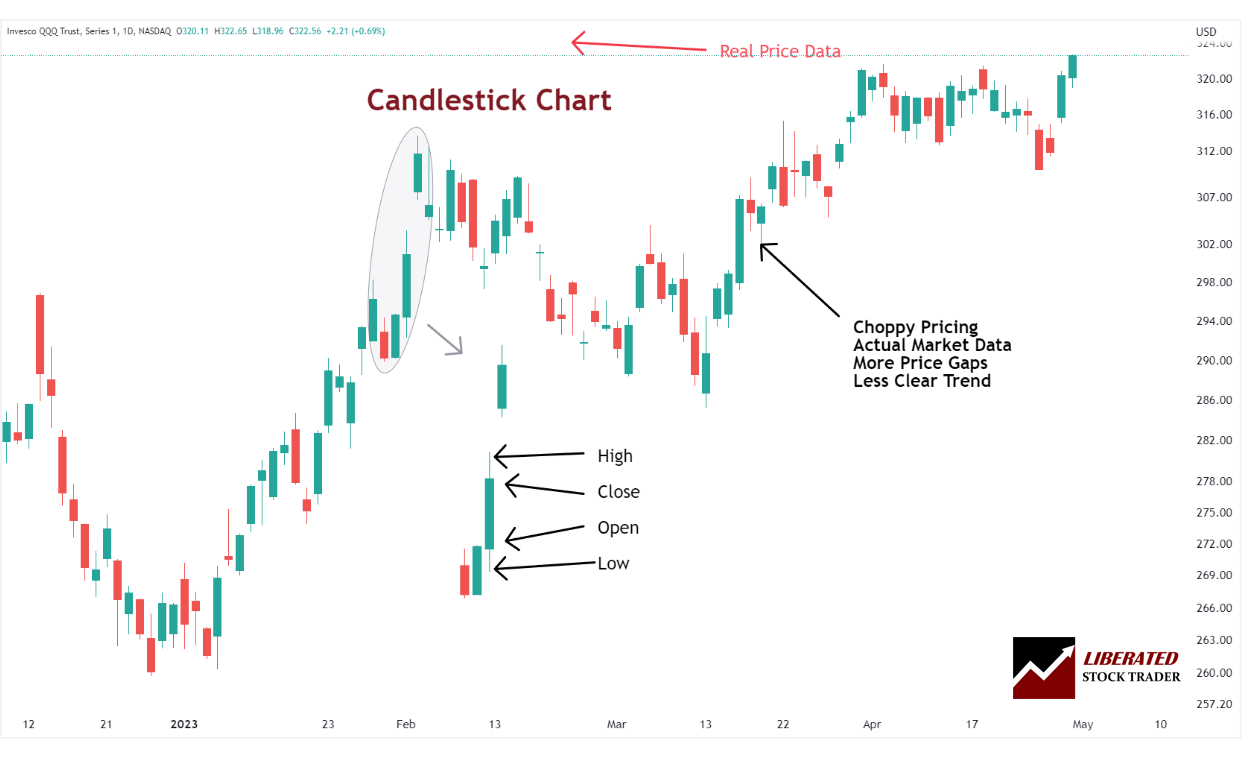
Candlestick charts have four main parts, open, high, low, and close. The body of a candlestick is represented by the range between an asset’s opening and closing price, while the wicks represent the highest and lowest points reached during that period. Candlestick charts visually represent this data and can provide valuable insights into future market movements.
Each candle displays a security’s high, low, open, and close prices for a specific period. Each bar looks like a ‘candle’ and comprises two parts: the body, a box representing the open and close, and the wick, representing the low and high.
Candlesticks consist of:
- Open – The open is the asset’s price at the start of trading that day.
- High – The highest price paid for an asset during that day’s trading session.
- Low – The low is the lowest price paid for an asset during that day’s trading session.
- Close – The closing price is the final price of the asset at the end of a given period.
What are Candlestick Patterns?
Candlestick patterns represent the psychology are people trading in a market. They comprise one or more candlesticks representing a particular trend or movement in the asset’s price. According to our testing, the most reliable and profitable candlestick patterns include the Inverted Hammer, Bearish Marubozu, Doji, and Bearish Engulfing patterns.
I use Candlestick charts exclusively when doing my analysis when you get used to how they work; they provide an unparalleled inside into the short-term market dynamics of a given stock.
How to Read Candlesticks
1. Use Automated Candlestick Recognition Software.
There are over 100 candlestick patterns to learn and recognize, making the whole analysis process very time-consuming. I would recommend using the power of modern stock charting software to recognize candlestick patterns for you.
The best candlestick pattern recognition software, which also includes backtesting and automated trading, is TrendSpider. TrendSpider recognizes 123 candles, and I use it for all my chart indicator testing and candle research. Additionally, TradingView can recognize 27 candle patterns automatically and is available for free.
| Candlestick Software | TrendSpider | TradingView | MetaStock |
| Rating | ★★★★★ | ★★★★☆ | ★★★☆☆ |
| Candle Patterns Recognized | 123 | 27 | 52 |
| Pricing | Included | Included | $349 add-on |
| Full Review | Read the Review | Read the Review | Read the Review |
| Visit | Try TrendSpider | Try TradingView | Try MetaStock |
These three stock market charting software have functionality that can better identify and analyze candlesticks than humans can. Give one a try.
✂ TrendSpider Presidents Day Sale is Live Now ✂
☆ 67% Off Yearly Plans ☆
☆42% Off Monthly Plans ☆
It's their biggest sale of the year.
2. Understand a Candle’s Body and Fill.
One must grasp the significance of body length and fill to decipher candlesticks. A lengthy hollow body signals a surge in stock price, driven by high demand. Conversely, a long-filled body indicates a significant drop in stock price triggered by increased selling. Lengthy wicks signify failed extreme highs or lows, foreshadowing short-term trend reversals.
A candlestick can be filled (black/red/solid) or hollow. Filled candles represent a closing price lower than their open, representing a price decline. Hollow candles represent a closing price higher than its open, showing a price increase.
The length of the body and wick provides insight into a stock’s overall sentiment. Long bodies represent significant movement in either direction (up or down), while short bodies signify minimal price change over a given period. Furthermore, long wicks indicate that buyers/sellers unsuccessfully pushed the price to extreme highs or lows before being overpowered by opposing forces.
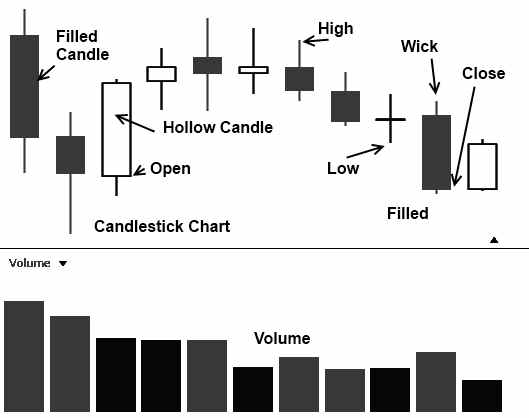
It is also worthy of note that candlesticks show the day’s price elegantly as the extent of the surge or “Trading Range” from Opening Price to Closing Price can be seen very clearly.
3. Note if a Candle is a Reversal or Continuation Pattern.
A candle continuation pattern is formed when the market sentiment remains unchanged and the price increases or decreases in the previous trend direction. A candle reversal pattern, on the other hand, occurs when a stock’s sentiment reverses from bearish to bullish or vice versa. In this case, there is an abrupt change in the direction of the price movement, often indicating a major shift in market sentiment for that particular asset. It could also indicate an opportunity for traders to open a position in anticipation of further price movements in that particular direction.
4. Recognize Bullish Candlestick Patterns.
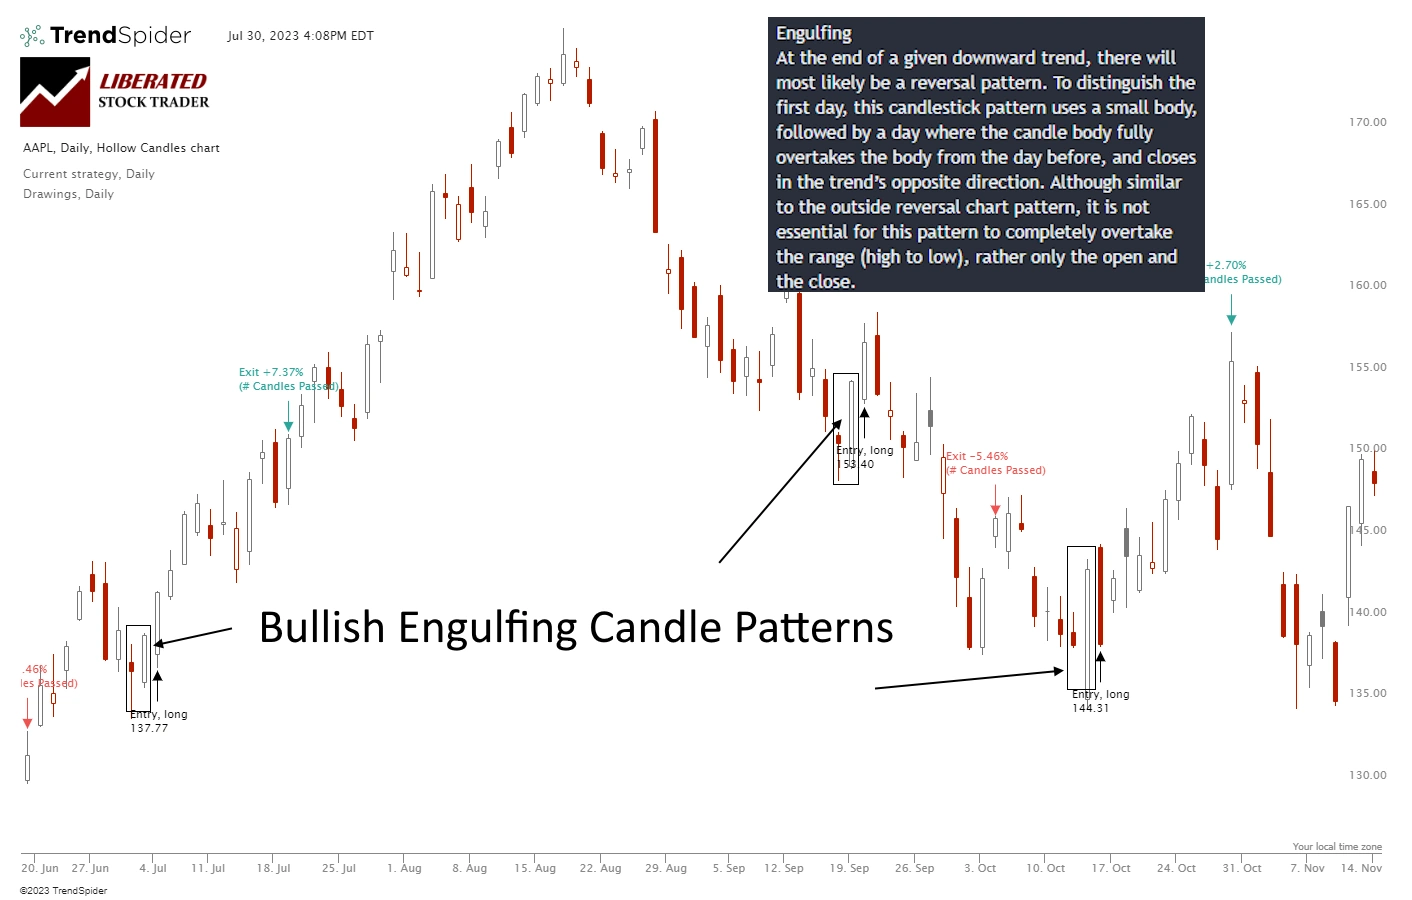
Bullish candle patterns signal to traders that the sentiment of an asset is shifting from bearish to bullish and are often used as a sign for traders to open positions. The most commonly seen bullish candle pattern is the Bullish Engulfing Pattern, which occurs when a small red (bearish) body is followed by a larger green (bullish) body that “engulfs” the prior red body. This signifies a strong switch in sentiment from sellers to buyers. Other bullish patterns include the Bullish Harami and Bullish Marubozu, which indicate potential reversal signals after long bearish trends.
5. Identify Bearish Candlestick Patterns.
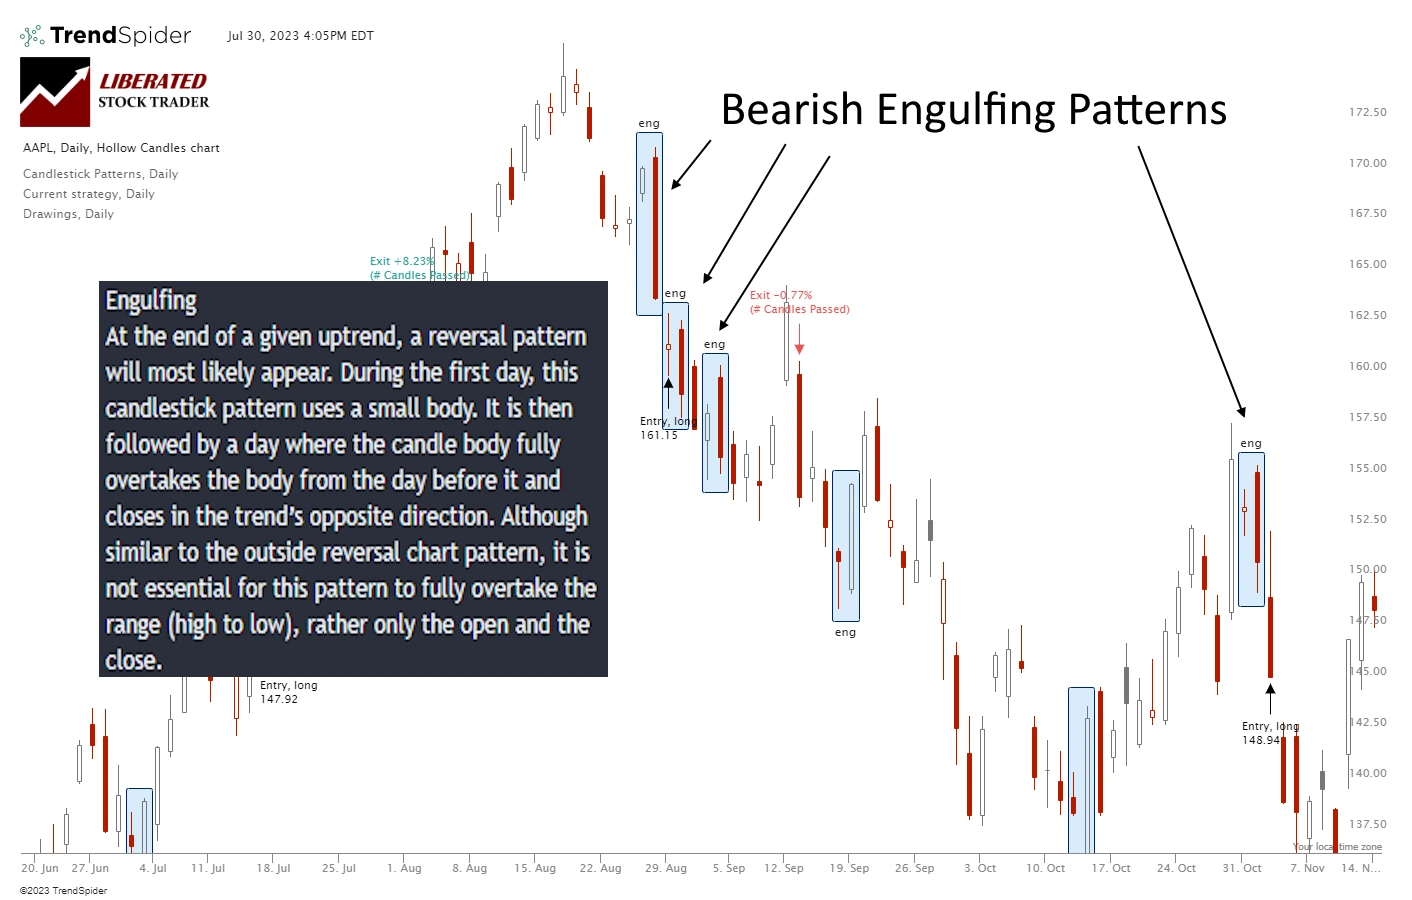
Bearish candle patterns signal to traders that the sentiment of an asset is shifting from bullish to bearish and are often used as a sign for traders to close positions. The most commonly seen bearish candle pattern is the Bearish Engulfing Pattern, which occurs when a small green (bullish) body is followed by a larger red (bearish) body that “engulfs” the prior green body. This signifies a strong switch in sentiment from buyers to sellers. Other bearish patterns include the Bearish Harami and Bearish Marubozu, which indicate potential reversal signals after long bullish trends.
6. Use the Most Reliable and Profitable Candles
Not all candle patterns are profitable or reliable. It is important you only use effective patterns in trading, or you are setting yourself up for significant losses. Many traders have no idea which candle patterns are profitable or reliable.
I have conducted hundreds of hours of detailed candlestick pattern testing, spanning 10,199 years of test data to prove which are the best.
Based on my research, I have identified several highly reliable and predictive candle chart patterns. The Inverted Hammer, boasting an impressive 60% success rate, leads the pack. Following closely behind are the Bearish Marubozu at 56.1%, the Gravestone Doji at 57%, and the Bearish Engulfing at 57%.
| Candle Pattern | Profitability/Trade | Bullish Reliability |
| Inverted Hammer | 1.12% | 60.0% |
| Bearish Marubozu | 0.80% | 56.1% |
| Gravestone Doji | 0.65% | 57.0% |
| Bearish Engulfing | 0.62% | 57.0% |
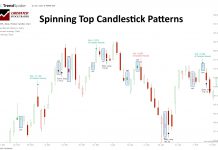
5 Reliable Candlestick Patterns for Trading
1. Inverted Hammer – 60% Reliable
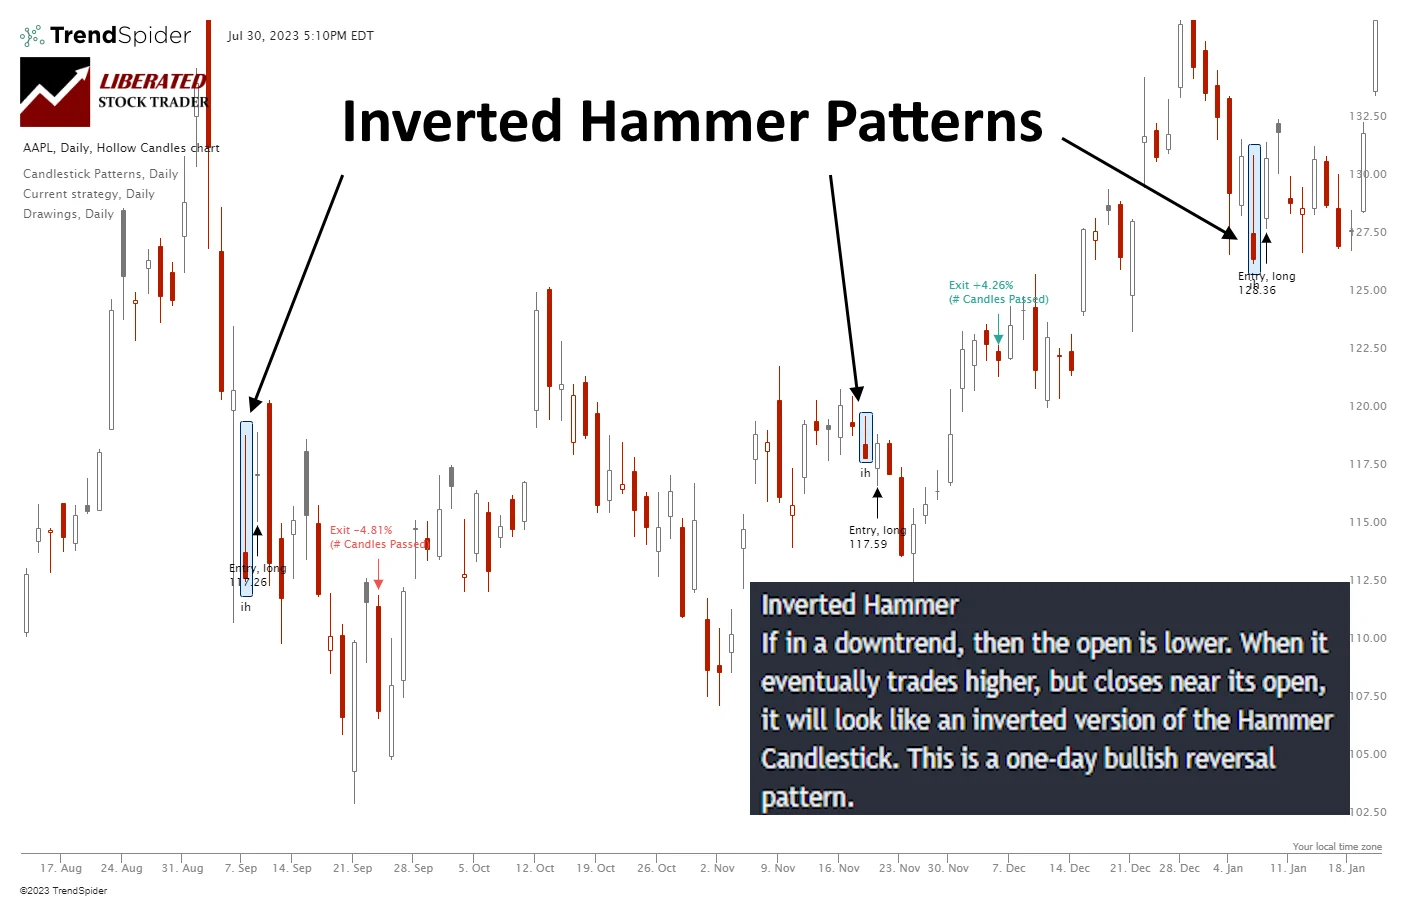
The Inverted Hammer usually appears at the end of a downtrend, indicating a possible change in price direction. This candlestick formation suggests a bullish sentiment, signifying the market’s attempt to push prices higher, as evidenced by the extended upper wick. However, sellers regain control by the end of the trading period, resulting in a price decline, and a small body forms near the bottom.
After analyzing 1,702 trades spanning 588 years of data, we have confirmed that the Inverted Hammer strategy yields an average profit of 1.12% per trade. This means that if you go long on an Inverted Hammer and sell after ten days, you can expect to make a 1.12% profit on each trade.
Candle Pattern Recognition with TrendSpider
Inverted Hammer: 1,702 Trades Prove Its The Best Candle Pattern
2. Bearish Marubozu – 56.1% Reliable
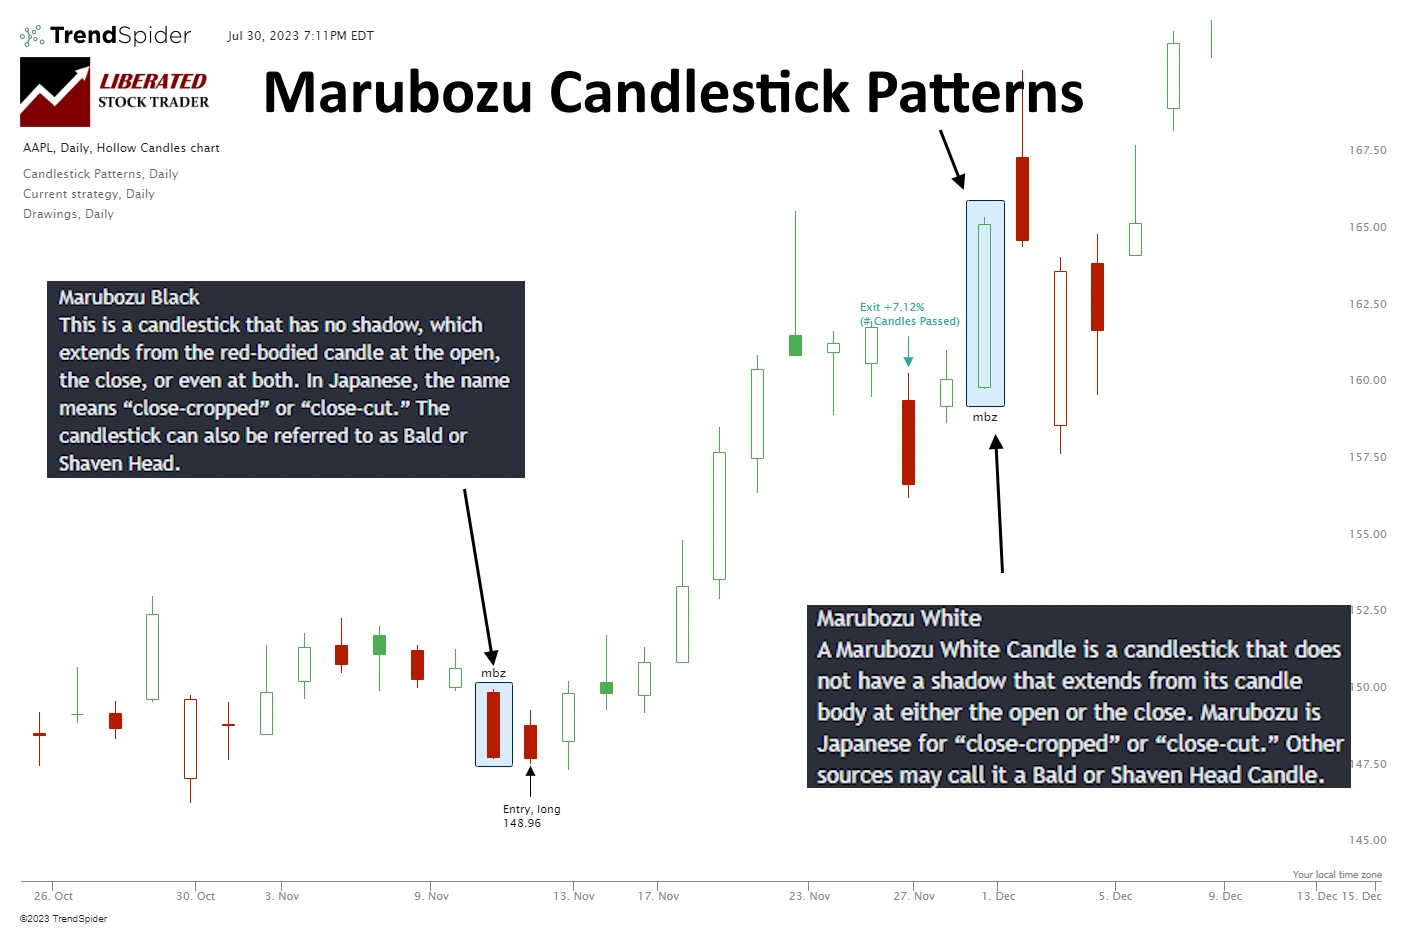
A Bearish Marubozu indicates a significant downward price shift. It emerges when the opening price is the highest within the given timeframe (whether it’s a day, an hour, or any other period) and the closing price is the lowest. In simpler terms, it signifies that bears have had full control over the price throughout the entire timeframe, accentuating the prevalence of selling pressure.
The percentage of Bearish Marubozu winning trades was 56.1%, with an average winning trade equalling 4.1%, significantly higher than the average performance across all candlestick types. The Max Drawdown was -31%, versus the stock’s drawdown of -59.7%, which shows less volatility than a buy-and-hold strategy.
The Bearish Marubozu’s reward-to-risk ratio is 1.21; I have only seen better Reward/Risk ratios in our testing of “The most successful chart patterns.”
Get Candle Pattern Recognition with TrendSpider
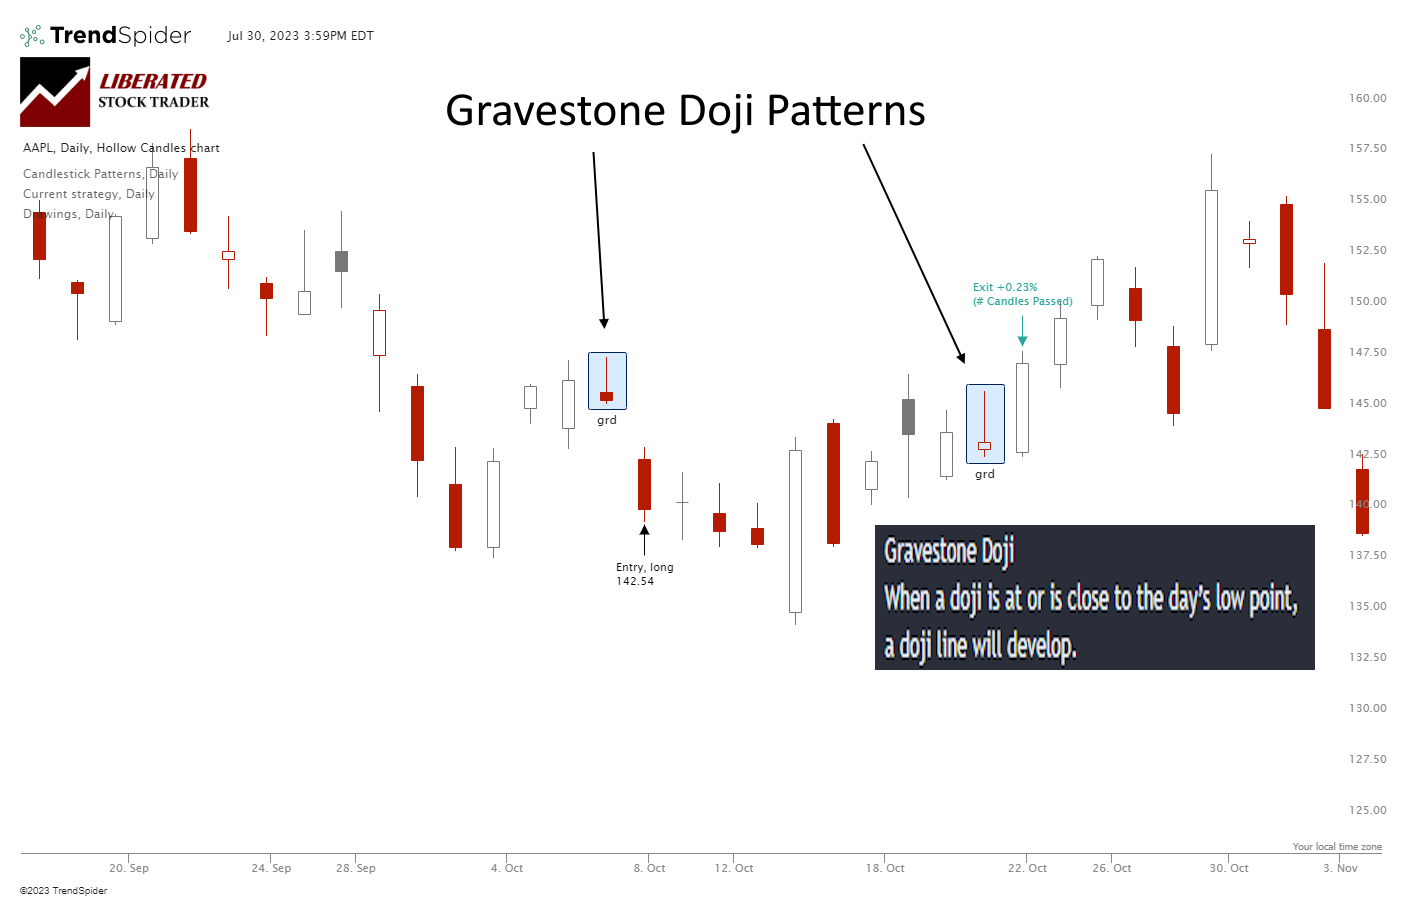
3. Gravestone Doji – 57% Success
The Gravestone Doji candlestick pattern emerges when a trading session’s opening, closing, and low prices closely align. Resembling a gravestone, this particular candle showcases a long wick at its top. Its significance lies in the fact that buyers were unsuccessful in driving prices higher, enabling sellers to bring them back down toward the session’s opening price by the end.
After conducting 1,553 trades on 575 years of data, we confirm the win rate to be 0.65% per trade. A 0.65% win rate means that trading a Gravestone Doji long will net you an average of 0.65% profit per trade if you sell after ten days. Conversely, short-selling a Gravestone Doji, you should expect to lose -0.65% per trade.
Candle Pattern Recognition with TrendSpider
Candles that are more reliable can help traders make profitable trades with higher accuracy, while less reliable candles increase risk and may not yield any return on investment.
4. Bearish Engulfing – 57% Reliable
According to the data, a Bearish Engulfing candle can appear in both uptrends and downtrends, serving as a reversal or continuation pattern. In the image below, you can observe four instances of Bearish Engulfing candles. Three of these candles appear during a downtrend, exacerbating the price decline, while one candle occurs amidst an uptrend, indicating a potential reversal.
After analyzing 4,096 trades spanning 568 years of data, we have confirmed that the Bearish Engulfing pattern yields a profit of 0.62% per trade. A 0.62% win rate indicates that if you go long on a Bearish Engulfing and sell after ten days, you can expect an average profit of 0.62% per trade. Conversely, if you short-sell a Bearish Engulfing, you should anticipate a loss of -0.62% per trade. This substantial evidence solidifies the bullish nature of this pattern.

Candle Pattern Recognition with TrendSpider
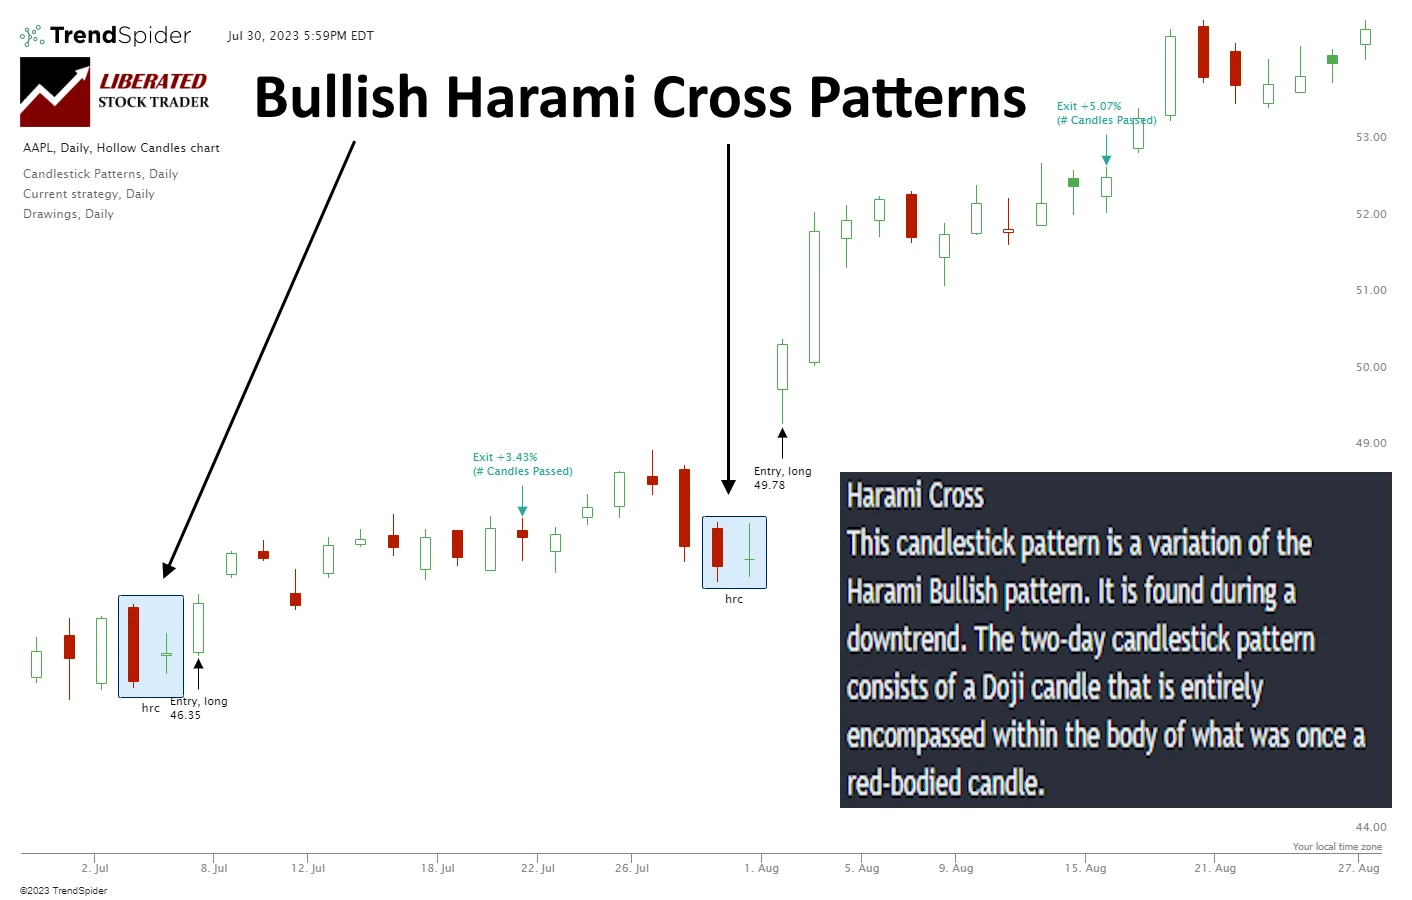
5. Bullish Harami Cross – 55.3% Reliable
The Bullish Harami Cross pattern signals a possible end to a bearish trend and the commencement of a bullish trend. While the first candle is still a bearish pattern with a significant move down, the second candle is usually a spinning top or Doji, meaning the open and close prices are similar and still contained within the bounds of the first candle.
Bullish Harami Cross trades boasted a winning percentage of 55.3%, with an average gain of 4.0%—far surpassing the average performance of other candlestick patterns. Notably, the maximum drawdown stood at -31.7%, indicating lower volatility than a simple buy-and-hold strategy, outperforming the stock’s drawdown of -59.3%. These findings highlight the reliability and potential of incorporating Bullish Harami Cross in trading strategies.
Get Candle Pattern Recognition with TrendSpider
Automate Candlestick Charting
Is this information overwhelming? Only 116 more Candlesticks remain to be memorized and recognized. Alternatively, you can utilize software that simplifies the task for you.
| Candlestick Software | TrendSpider | TradingView | MetaStock |
| Rating | ★★★★★ | ★★★★ | ★★★ |
| Patterns Recognized | 123 | 27 | 52 |
| Pricing | Included | Included | $349 add-on |
| Full Review | Read the Review | Read the Review | Read the Review |
| Get the Software | Visit TrendSpider | Visit TradingView | Visit MetaStock |

Candlestick Charts Summary
Every candlestick pattern holds a unique tale waiting to be unraveled. Instead of relying on memorization of pattern names and textbook explanations, immerse yourself in the article once more and let your imagination weave the tale. By analyzing the collective behavior of multiple days, you can gain profound insights into the current mindset of market participants and a valuable glimpse into future price action.
FAQ
How can I automate reading candlestick patterns?
You can automate candlestick pattern recognition using specialized software like TrendSpider, or TradingView. These tools enable you to identify and analyze existing patterns and create custom patterns for automated trading and backtesting.
What are the basics of candlestick charts?
The basic things to remember about candles are they are hollow it's bullish, filled it's bearish. Additionally, the length of the wick shows the volatility of the day's trading. Finally, if the candle body is towards the top of the bar, it is positive, and at the bottom, it is negative.
What is a Filled Candle?
A filled candle is a bearish candlestick pattern where the opening price is higher than the closing price. This indicates that sellers were able to move prices lower, which signals potential weakness in the security. Filled candles are sometimes called red or black, although this can vary depending on chart type and color settings.
What is a Doji candle?
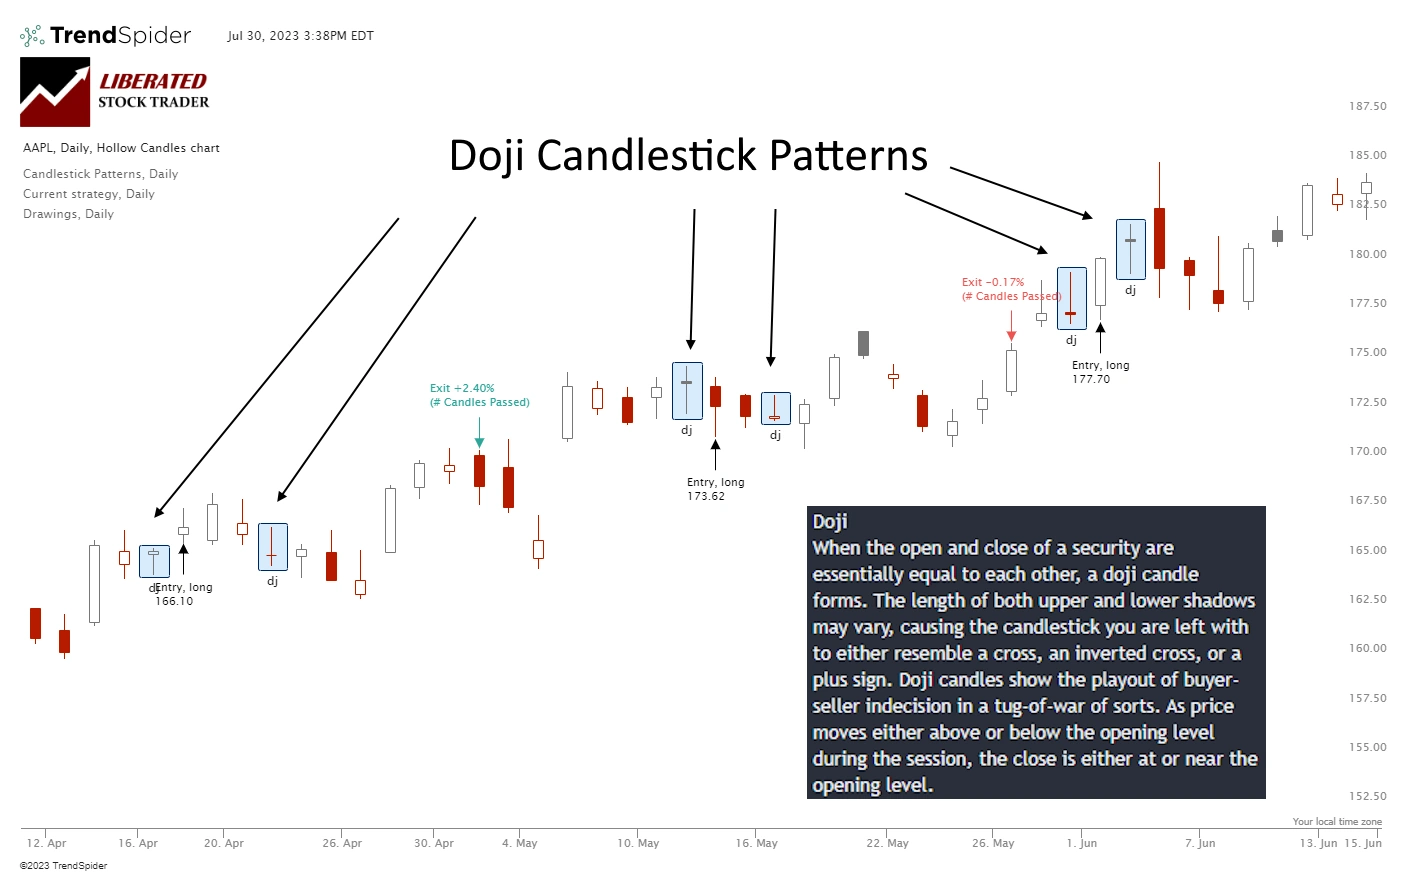
A Doji candle is a pattern whereby the open and close prices are almost equal. This usually signals a potential battle between buyers and sellers, leading to indecision in the market. Depending on preceding candles, a doji candle could signal a reversal of trend or increased momentum in an existing trend.
What is an Engulfing Candle?
An engulfing candle is a two-candle pattern where the second candle completely "engulfs" the range of the first candle. This pattern usually signals a potential reversal in trend. A bullish engulfing candle typically has a filled black candle followed by a larger white candle, while a bearish engulfing candle may have a white filled candle followed by a larger black one.
What is a Hollow Candle?
A hollow candle means that buyers are in control and are pushing prices up. Hollow candles can signal higher prices or increased momentum in an existing trend.
What is a Hammer Candle?
A hammer candle is a single-candle reversal pattern with a long lower wick with minimal to no upper wick. This pattern signals that a bullish trend may be emerging and confirms the prior downtrend may be over. A hammer candle is considered more reliable at or near support levels.
What is the Wick in a Candle Pattern?
The wick in a candle pattern is the thin line above or below the body that shows the highest and lowest prices during a given period. The upper wick shows the highest price, while the lower wick shows the lowest price. The further the wick from the body, the more volatile the trading day.
What is an Engulfing Candle?
An engulfing candle is when one candle completely "engulfs" the body of another, typically either a bullish or bearish candle. The engulfing candle can be considered a sign of reversal in the price trend. A bullish engulfing pattern occurs when a large white (or green) real body completely "engulfs" a smaller black (or red) real body from the prior period.
What is a Candle Reversal Pattern?
A candle reversal pattern is a type of candlestick formation that can signal a potential trend reversal. Popular candle reversal patterns include the Hammer, Bullish Engulfing, and Bearish Marubozu patterns.
What is a Candle Continuation Pattern?
A candle continuation pattern is a type of candlestick formation that can signal a potential trend continuation. Popular candle continuation patterns include the Bullish Three Line Strike, Bearish Harami, and Piercing Line patterns.
How do I recognize bullish candlestick patterns?
To spot bullish candlestick patterns, look for closing prices higher than opening prices, indicating that buyers are exerting more upside pressure. Also, the candles will be green/white and have a hollow body.
How to identify bearish candlestick patterns?
To recognize bearish candlestick patterns, look for closing prices lower than opening prices, indicating that sellers are exerting more downside pressure. Also, the candles will be red/black and have a filled body.
What strategies can I use when trading with candlestick patterns?
When trading with candlestick patterns, traders should focus on entry points, target prices, and risk management techniques. Traders can also look for reversal patterns, such as the Hammer and Hanging Man, or continuation patterns, such as the Morning and Evening Star.
What are the best candles to trade?
Based on my research, the best candles to trade are Inverted Hammers, Bearish Engulfing, Gravestone Dojis, Bearish Marubozus, and Harami patterns. These candlesticks have good reliability numbers in testing.
You want to be a successful stock investor but don’t know where to start.
Learning stock market investing on your own can be overwhelming. There’s so much information out there, and it’s hard to know what’s true and what’s not.
Liberated Stock Trader Pro Investing Course
Our pro investing classes are the perfect way to learn stock investing. You will learn everything you need to know about financial analysis, charts, stock screening, and portfolio building so you can start building wealth today.
★ 16 Hours of Video Lessons + eBook ★
★ Complete Financial Analysis Lessons ★
★ 6 Proven Investing Strategies ★
★ Professional Grade Stock Chart Analysis Classes ★




You you could make changes to the page title Chapter 6 – Introduction to Japanese Candlesticks :: Stock Market Training Course,Technical Analysis Course,Share Market Education to something more suited for your content you create. I enjoyed the post nevertheless.
hello Barry–i’m assuming that a gravestone doji has the body(what there is of it) at the bottom of the shadow–just to be sure—praises again for this site!–S.
Hi Steve, thanks for the positive comments, yes you are exactly right. That reminds me I have a post on Bullish reversal candlestick patterns here https://www.liberatedstocktrader.com/2-japanese-candlesticks-bullish-reversal-patterns/
I have not as yet added a post about Bearish reversal patterns. A Gravestone Doji is one of the easiest Bearish reversal patterns to spot and usually occurs during an uptrend.
Hi guy,I view your essay now,I believe it’s wonderful,Thank you for sharing.
Great site
I really think that this blog can help people. Well done
Just want to say your article is striking. The clarity in your post is simply striking and i can take for granted you are an expert on this subject. Well with your permission allow me to grab your rss feed to keep up to date with forthcoming post. Thanks a million and please keep up the accomplished work. Excuse my poor English. English is not my mother tongue.
I dont use candlestick much,but i read in books and seen, when Doji with low volume is sign downtrend- doji with high volume is sign of uptrend. Doji when compared with volume, makes powerful. I am not sure how far this is valid and true. Any thoughts on this.
A Doji is a sign of indecision, perhaps change of trend, from up to down, up to sideways etc. Volume is also good to know. A gravestone doji at the top of an uptrend is considered the end of the trend.
Hi there, I found your blog via Google while searching for first aid for a heart attack and your post looks very interesting for me.
Hi Rosario, thanks for the positive comment, I hope the Heart Attack search was not for someone you know.